ggvis中的Position_fill函数的等效功能是什么?

3
尝试在ggvis中复制ggplot函数“position = fill”。我经常在结果展示中使用这个方便的功能。 ggplot2 + ggvis代码成功重现可重复的示例。是否可以使用“scale_numeric”函数完成?
library(ggplot2)
p <- ggplot(mtcars, aes(x=factor(cyl), fill=factor(vs)))
p+geom_bar()
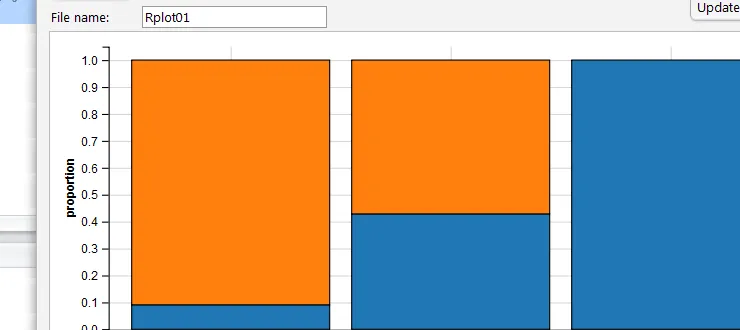
p+geom_bar(position="fill")

library(ggvis)
q <- mtcars %>%
  ggvis(~factor(cyl), fill = ~factor(vs))%>%
  layer_bars()

# Something like this?
q %>% scale_numeric("y", domain = c(0,1))
1个回答

0

我认为如果要使用ggvis来完成这种任务,你需要在将数据发送到ggvis之前进行大量的数据重塑工作。相比之下,ggplot2的geom_bar可以轻松地为您执行许多计算(计数、加权等),而在ggvis中,您需要自己明确地执行这些计算。因此,尝试像下面这样做(可能还有更优雅的方法):

mtcars %>%
   mutate(cyl=factor(cyl), vs=as.factor(vs)) %>%
   group_by(cyl, vs) %>%
   summarise(count=length(mpg)) %>%
   group_by(cyl) %>%
   mutate(proportion = count / sum(count)) %>%
   ggvis(x= ~cyl, y = ~proportion, fill = ~vs) %>%
   layer_bars()

enter image description here


网页内容由stack overflow 提供, 点击上面的
可以查看英文原文,
原文链接