提取时间间隔的重叠部分以计算可用性。

3
我有一个关于故障时间的数据集。故障的开始在“Begin”列,结束在“End”列。
此外,还有3个故障类别,它们在时间上也可能重叠。
我的实际目标是计算每天没有故障的时间段的总和。(实际上,类别并不重要,我不需要对类别进行细分)。
为了更好地说明,以下是一个关于故障时间跨越3天的示例数据集:
> df_time
# A tibble: 8 × 3
  Category Begin               End                
  <chr>    <dttm>              <dttm>             
1 A        2023-07-15 01:40:11 2023-07-15 13:43:15
2 A        2023-07-16 05:54:44 2023-07-16 10:50:45
3 B        2023-08-16 07:43:09 2023-08-16 16:42:12
4 C        2023-08-16 12:00:00 2023-08-16 13:11:13
5 A        2023-08-16 18:00:00 2023-08-16 19:30:00
6 A        2023-08-17 08:00:00 2023-08-17 13:00:00
7 C        2023-08-17 11:12:45 2023-08-17 19:58:22
8 A        2023-08-17 19:01:45 2023-08-17 23:59:59

我现在尝试以图形方式可视化故障时间: enter image description here 
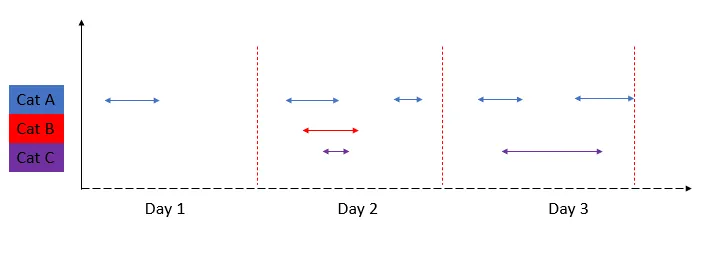
现在我想计算每个日历日的摘要,显示没有发生任何故障的分钟数(或小时数或秒数)。
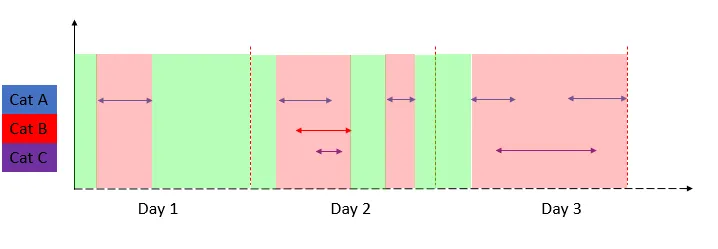
 这是每天所有绿色时间间隔的总和: enter image description here 如果只有一个故障类别,可以简单地计算24小时减去故障间隔。 然而,我在处理不同重叠的故障间隔时无法进一步。 有人能帮我计算无故障期间和/或每日故障期间吗?
我想象中的评估可能是这样的:(结果可能与上面的示例数据集不完全相同)
  Date       OK_times malfunction_times
  <date>     <chr>    <chr>
1 2023-07-15 17 hours 7 hours
2 2023-07-16 5 Hours  19 hours
3 2023-07-17 3 hours  21 hours

以下是创建示例数据框的代码:
library(tidyverse)

df_time <- tibble(
  Category = c("A", "A", "B", "C", "A", "A", "C", "A"),
  Begin = as_datetime(c(
    "2023-07-15 01:40:11",
    "2023-07-16 05:54:44",
    "2023-08-16 07:43:09",
    "2023-08-16 12:00:00",
    "2023-08-16 18:00:00",
    "2023-08-17 08:00:00",
    "2023-08-17 11:12:45",
    "2023-08-17 19:01:45"
    )),
  End = as_datetime(c(
    "2023-07-15 13:43:15",
    "2023-07-16 10:50:45",
    "2023-08-16 16:42:12",
    "2023-08-16 13:11:13",
    "2023-08-16 19:30:00",
    "2023-08-17 13:00:00",
    "2023-08-17 19:58:22",
    "2023-08-17 23:59:59"
    ))
)

如果故障发生在午夜之前到午夜之后,会怎么样呢? - Allan Cameron
1
我已经有一个先前的过程,将这个时间间隔在午夜分成两个不同的间隔。 请参阅:https://dev59.com/RFd1hooBIXSAPYfQ7XBk#76905774 - TobKel
这基本上就是 https://adventofcode.com/2022/day/4 :-) - Mark
2个回答

1
interval_intersects <- function(i1, i2) { 
  # check if there's an overlap between the two intervals
  between(i1$Begin, i2$Begin, i2$End) | between(i1$End, i2$Begin, i2$End) | between(i2$Begin, i1$Begin, i1$End) | between(i2$End, i1$Begin, i1$End)
}

tidy_intervals <- function(df) {
  out <- df[0,] # empty tibble with the columns of the input df
  
  while (nrow(df) > 0) {
    matched = FALSE
    if (nrow(out) != 0) { # this is so janky but R will try to loop through the dataframe, even when it has no rows, even using seq_along
      
      # for each row in out, check if it intersects with the current row
      for (j in 1:nrow(out)) {

        # if it does, update the current output row to be the minimum of the two begin times and the maximum of the two end times
        if (interval_intersects(df[1, ], out[j, ])) {
          matched = TRUE
          out[j, ] <- tibble(
            Begin = min(df[1,]$Begin, out[j,]$Begin),
            End = max(df[1,]$End, out[j,]$End)
          )
          break
        }
      }
    }
    # if the current row didn't intersect with any of the output rows, append it to the output
    if (!matched) {
      out <- out |> add_row(
        Begin = df[1,]$Begin,
        End = df[1,]$End)
    }

    # remove the current row from the input
    df <- df[-1, ]
  }
  return(out)
}

tidy_intervals(df_time |> select(-Category)) |> 
  ##### everything from here until later is from the old answer https://dev59.com/RFd1hooBIXSAPYfQ7XBk#76905774 #####
  mutate(b = as.Date(Begin), e = as.Date(End),
        # create a sequence of dates between begin and end
        days = map2(b, e, ~ seq.Date(.x, .y, by = "1 day"))) |>
  # unnest the days column into many rows
  unnest(days) |>
  # if the beginning date is the same as the date in `days`, then use the original Begin column
  # else, use `days` as a datetime
  mutate(Begin = if_else(b == days, Begin, as_datetime(days)),
         # same with End, but subtracting one minute
         End = if_else(e == days, End, as_datetime(days) + days(1) - seconds(1)), .keep = "unused") |> 
 #### new stuff starts here ####
  mutate(Date = as.Date(Begin), 
         malfunction_times = End - Begin) |>
  reframe(malfunction_times = round(sum(malfunction_times)),
          OK_times = 24 - malfunction_times, .by = Date)

输出:

# A tibble: 4 × 3
  Date       malfunction_times OK_times
  <date>     <drtn>            <drtn>  
1 2023-07-15 12 hours          12 hours
2 2023-07-16  5 hours          19 hours
3 2023-08-16 10 hours          14 hours
4 2023-08-17 16 hours           8 hours

我已经在我的真实数据集上测试了你的方法。然而,由于存在多个重叠的时间段,输出仍然是不正确的。 - TobKel
你能给个另外的例子吗?@TobKel :-) - Mark

0
我可以建议一个更直观但不太高效的替代方案。主要思想是将所有间隔创建为以秒为单位的向量,然后去除重复(重叠),最后检查每一天中有多少秒的故障发生在此天内。
# get days as numerics
begin_day <- as.numeric(as_datetime(date(df_time$Begin)))
days <- unique(begin_day)

# get times as numerics
begin_time <- as.numeric(df_time$Begin)
end_time <- as.numeric(df_time$End)

# create intervals as vectors of seconds and make them unique
# in other words: all overlaps are merged
intervals <- Map(function(x, y) x:y, begin_time, end_time)
intervals_unique <- unique(unlist(intervals))

# now we simply check how many seconds of a day overlap with the intervals
res <- sapply(days, function(x) sum(intervals_unique >= x & intervals_unique < x + 24 * 60 * 60))

data.frame(date = as_datetime(days), malfunction = res / (60 * 60))

生产中:
        date malfunction
1 2023-07-15   12.051389
2 2023-07-16    4.933889
3 2023-08-16   10.484722
4 2023-08-17   16.000000

通过过滤数据帧以获取特定日期,然后应用该过程,可以使其更高效。这将使intervals_unique向量变小。在这里,我只是想演示一般的思路。结果似乎与马克的解决方案相吻合。


另一种类似的做法是创建一个秒钟集合,然后找到集合的长度 :-) - Mark

网页内容由stack overflow 提供, 点击上面的
可以查看英文原文,
原文链接