使用OpenCV自动调整彩色纸张照片的对比度和亮度

107

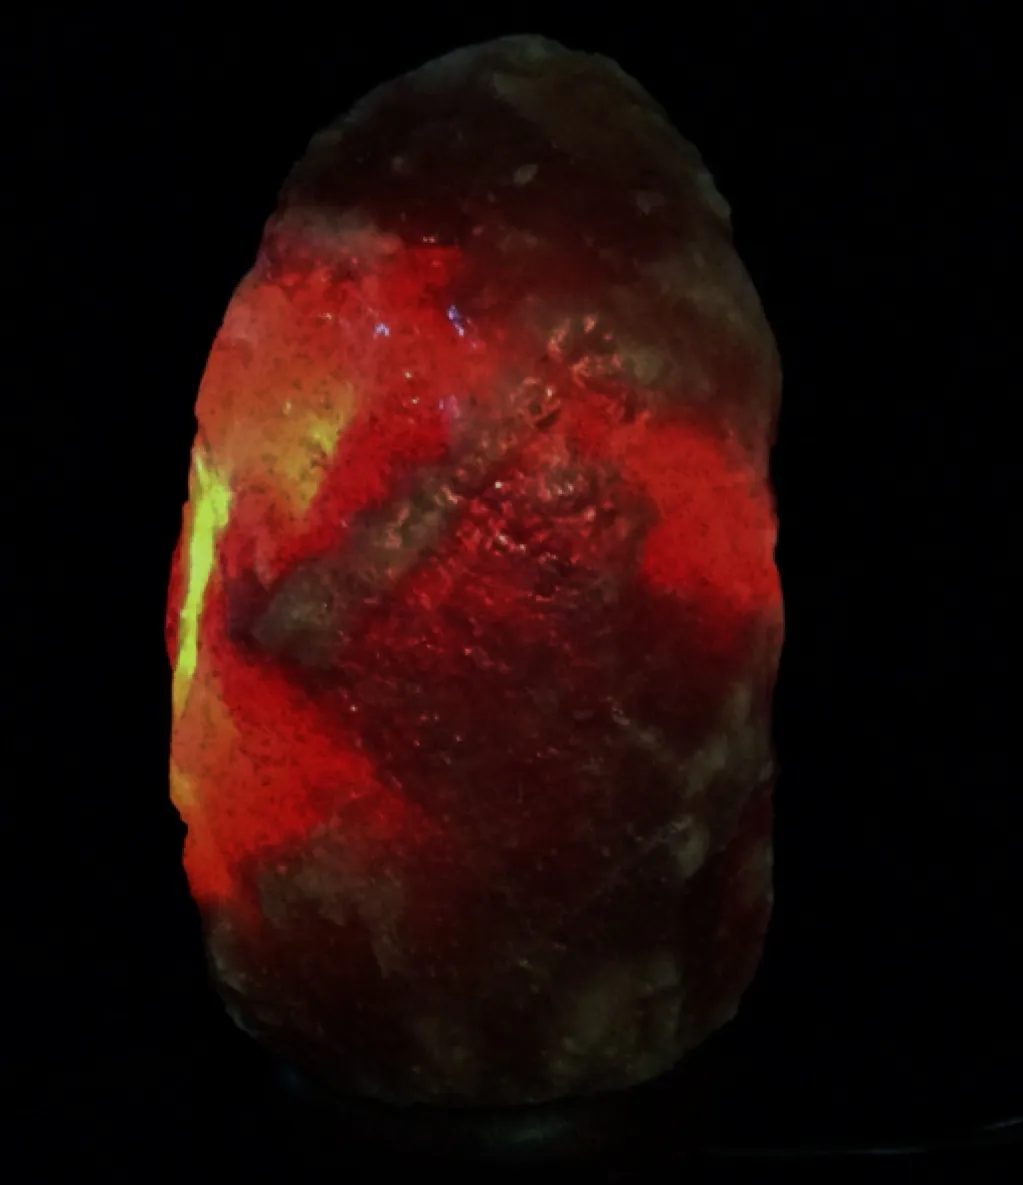
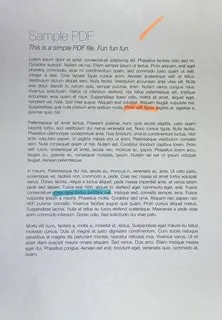
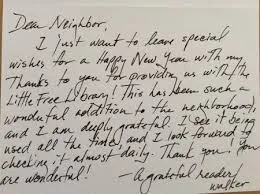
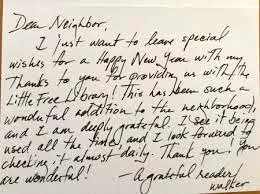
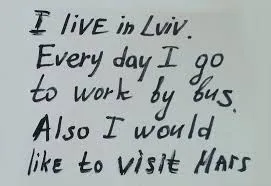
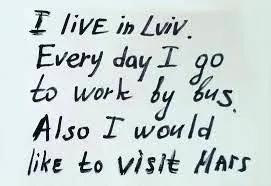
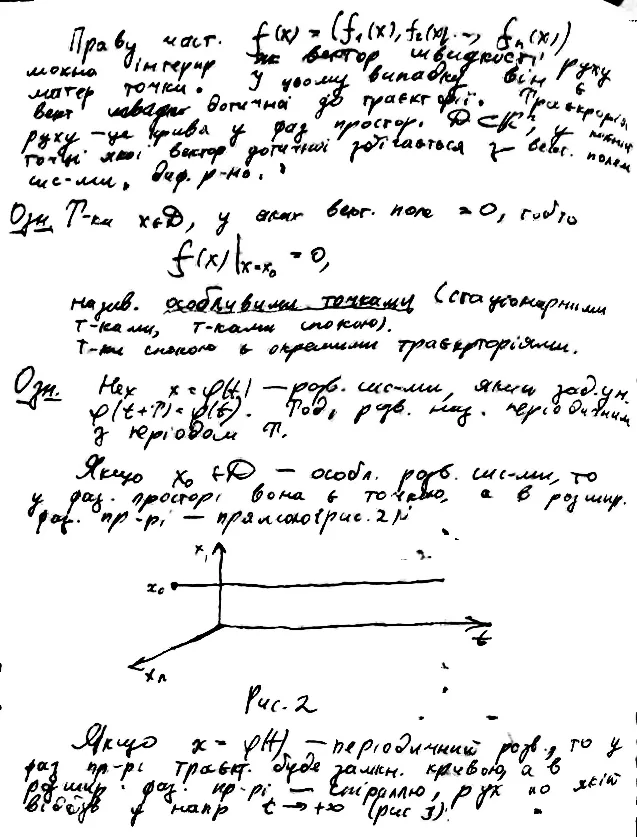
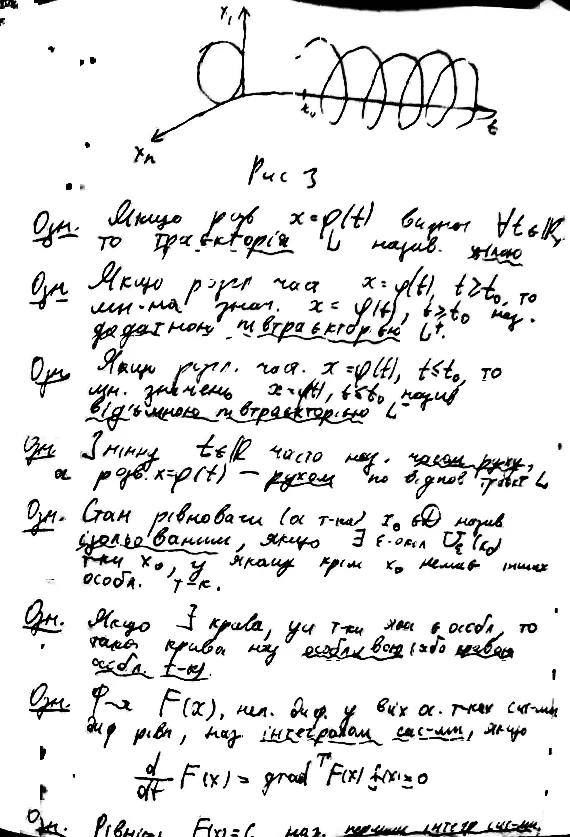
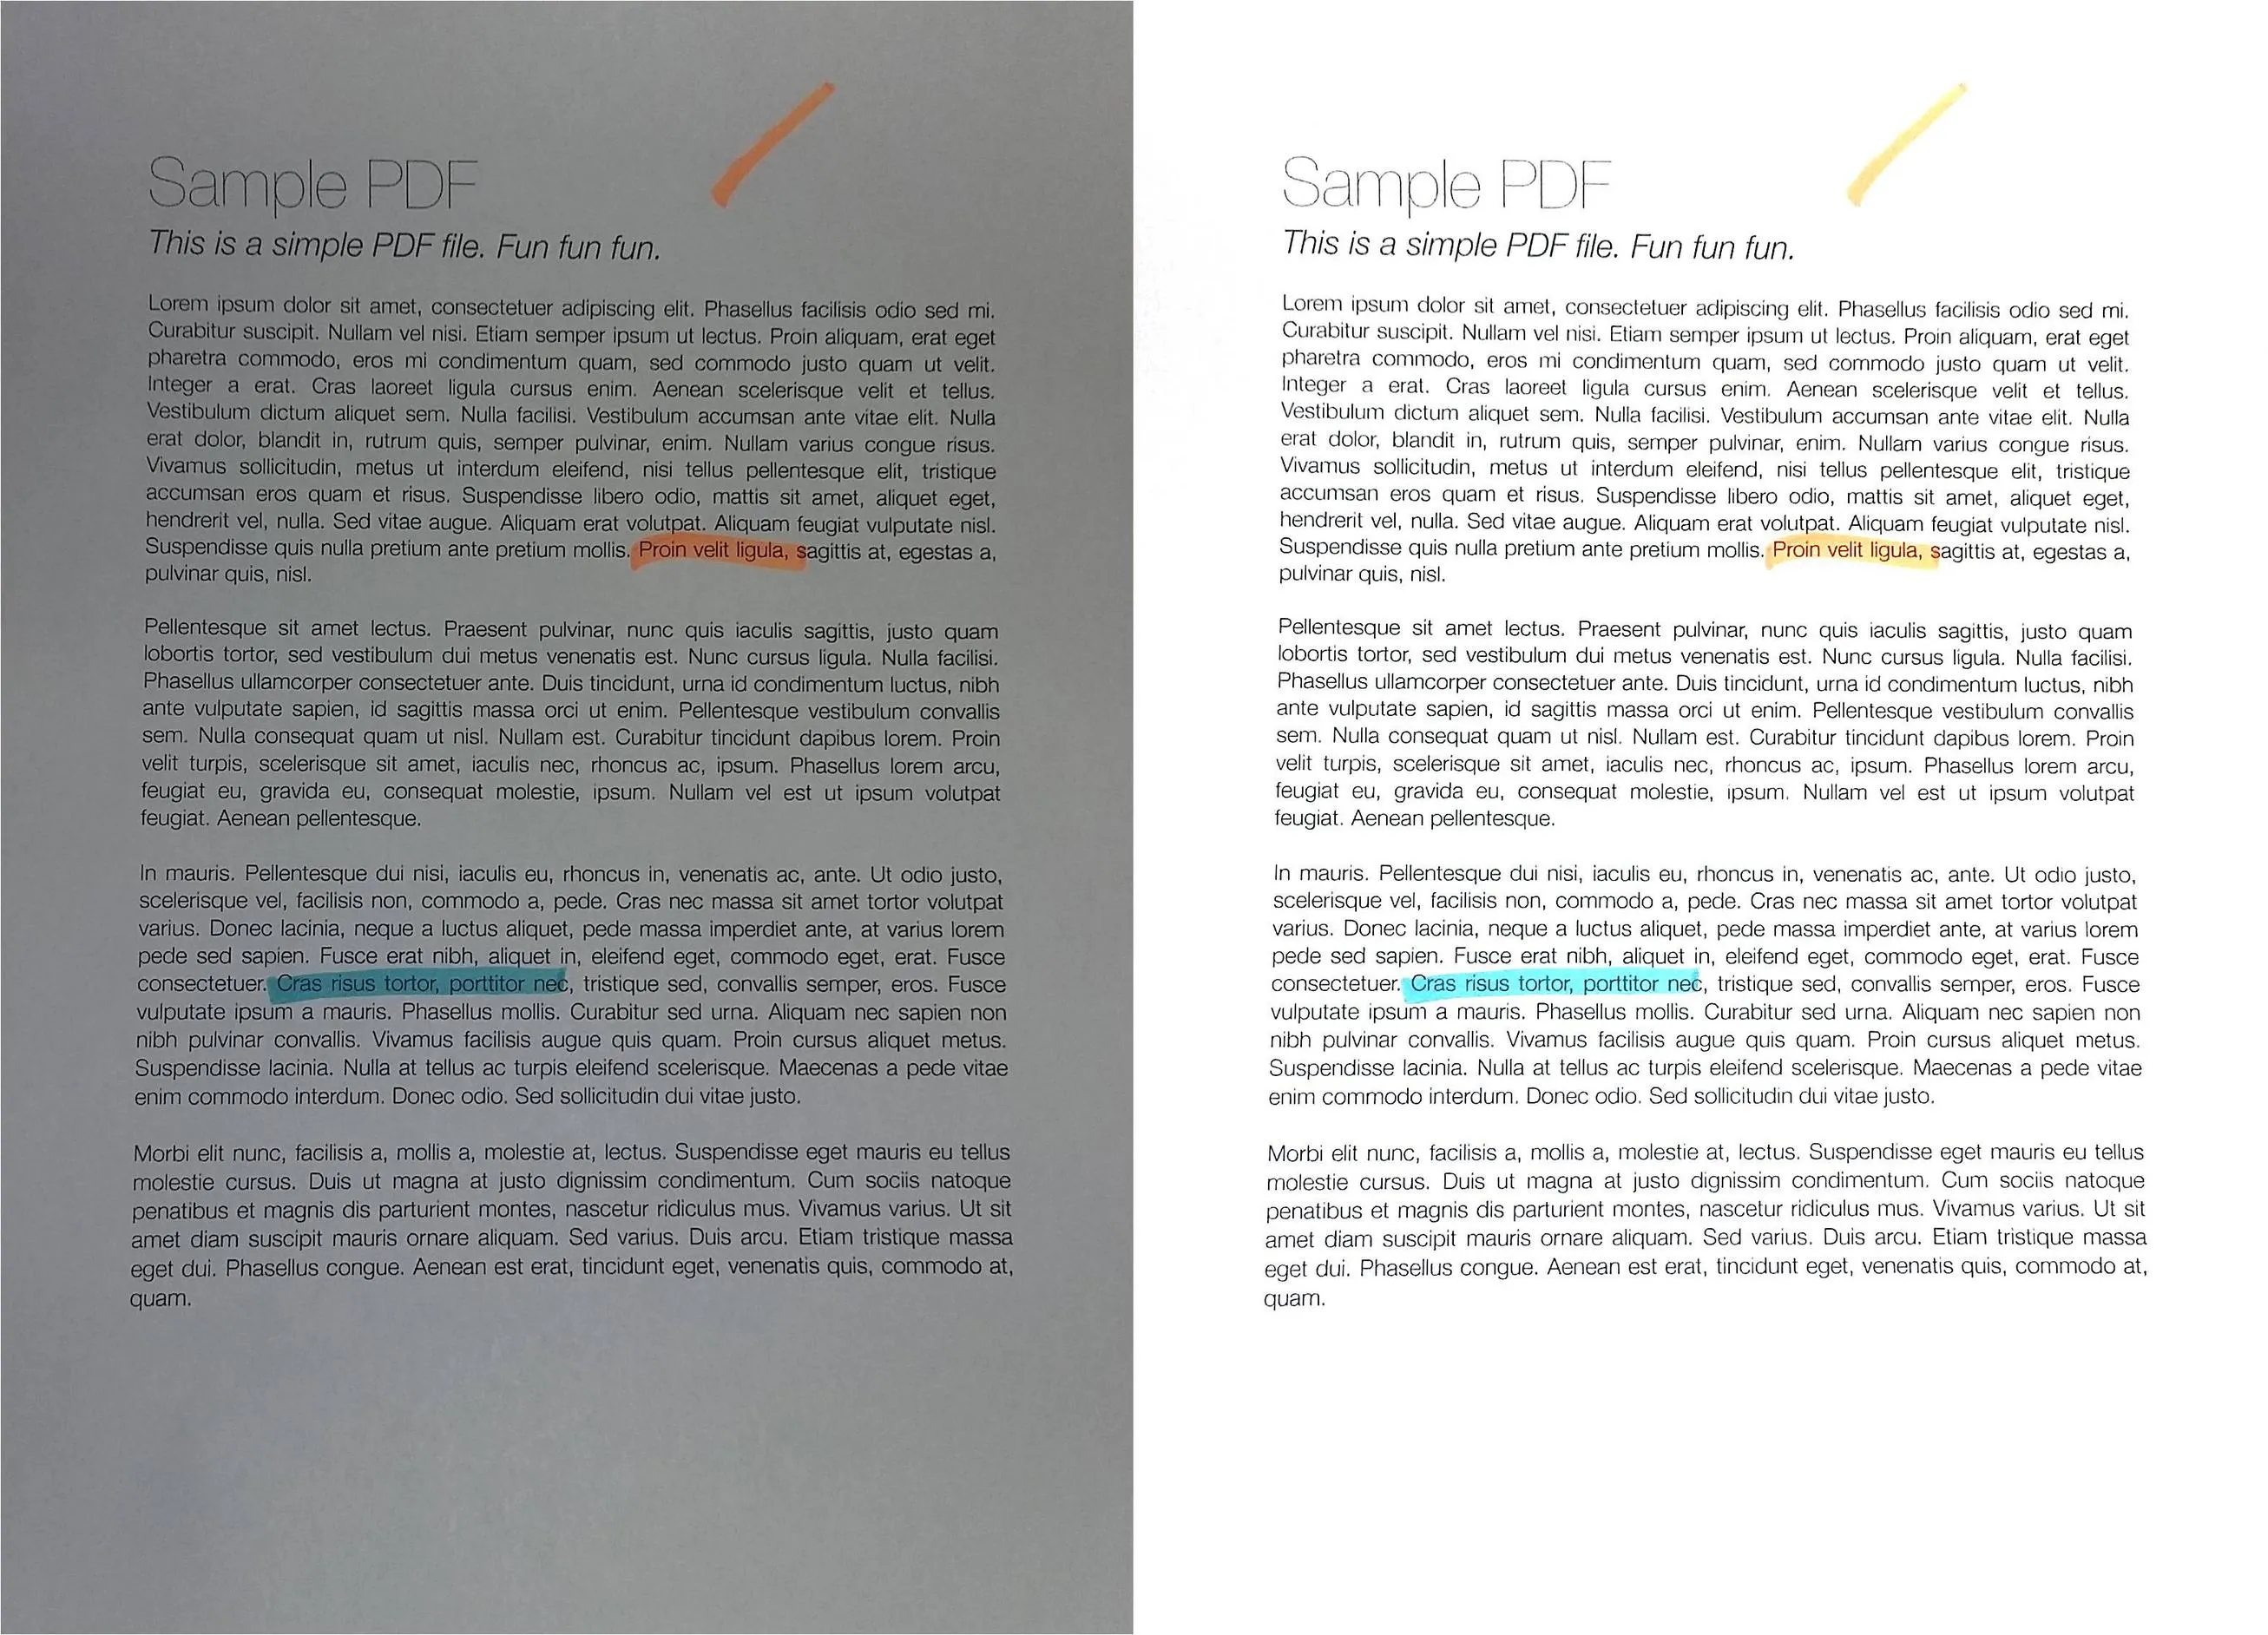
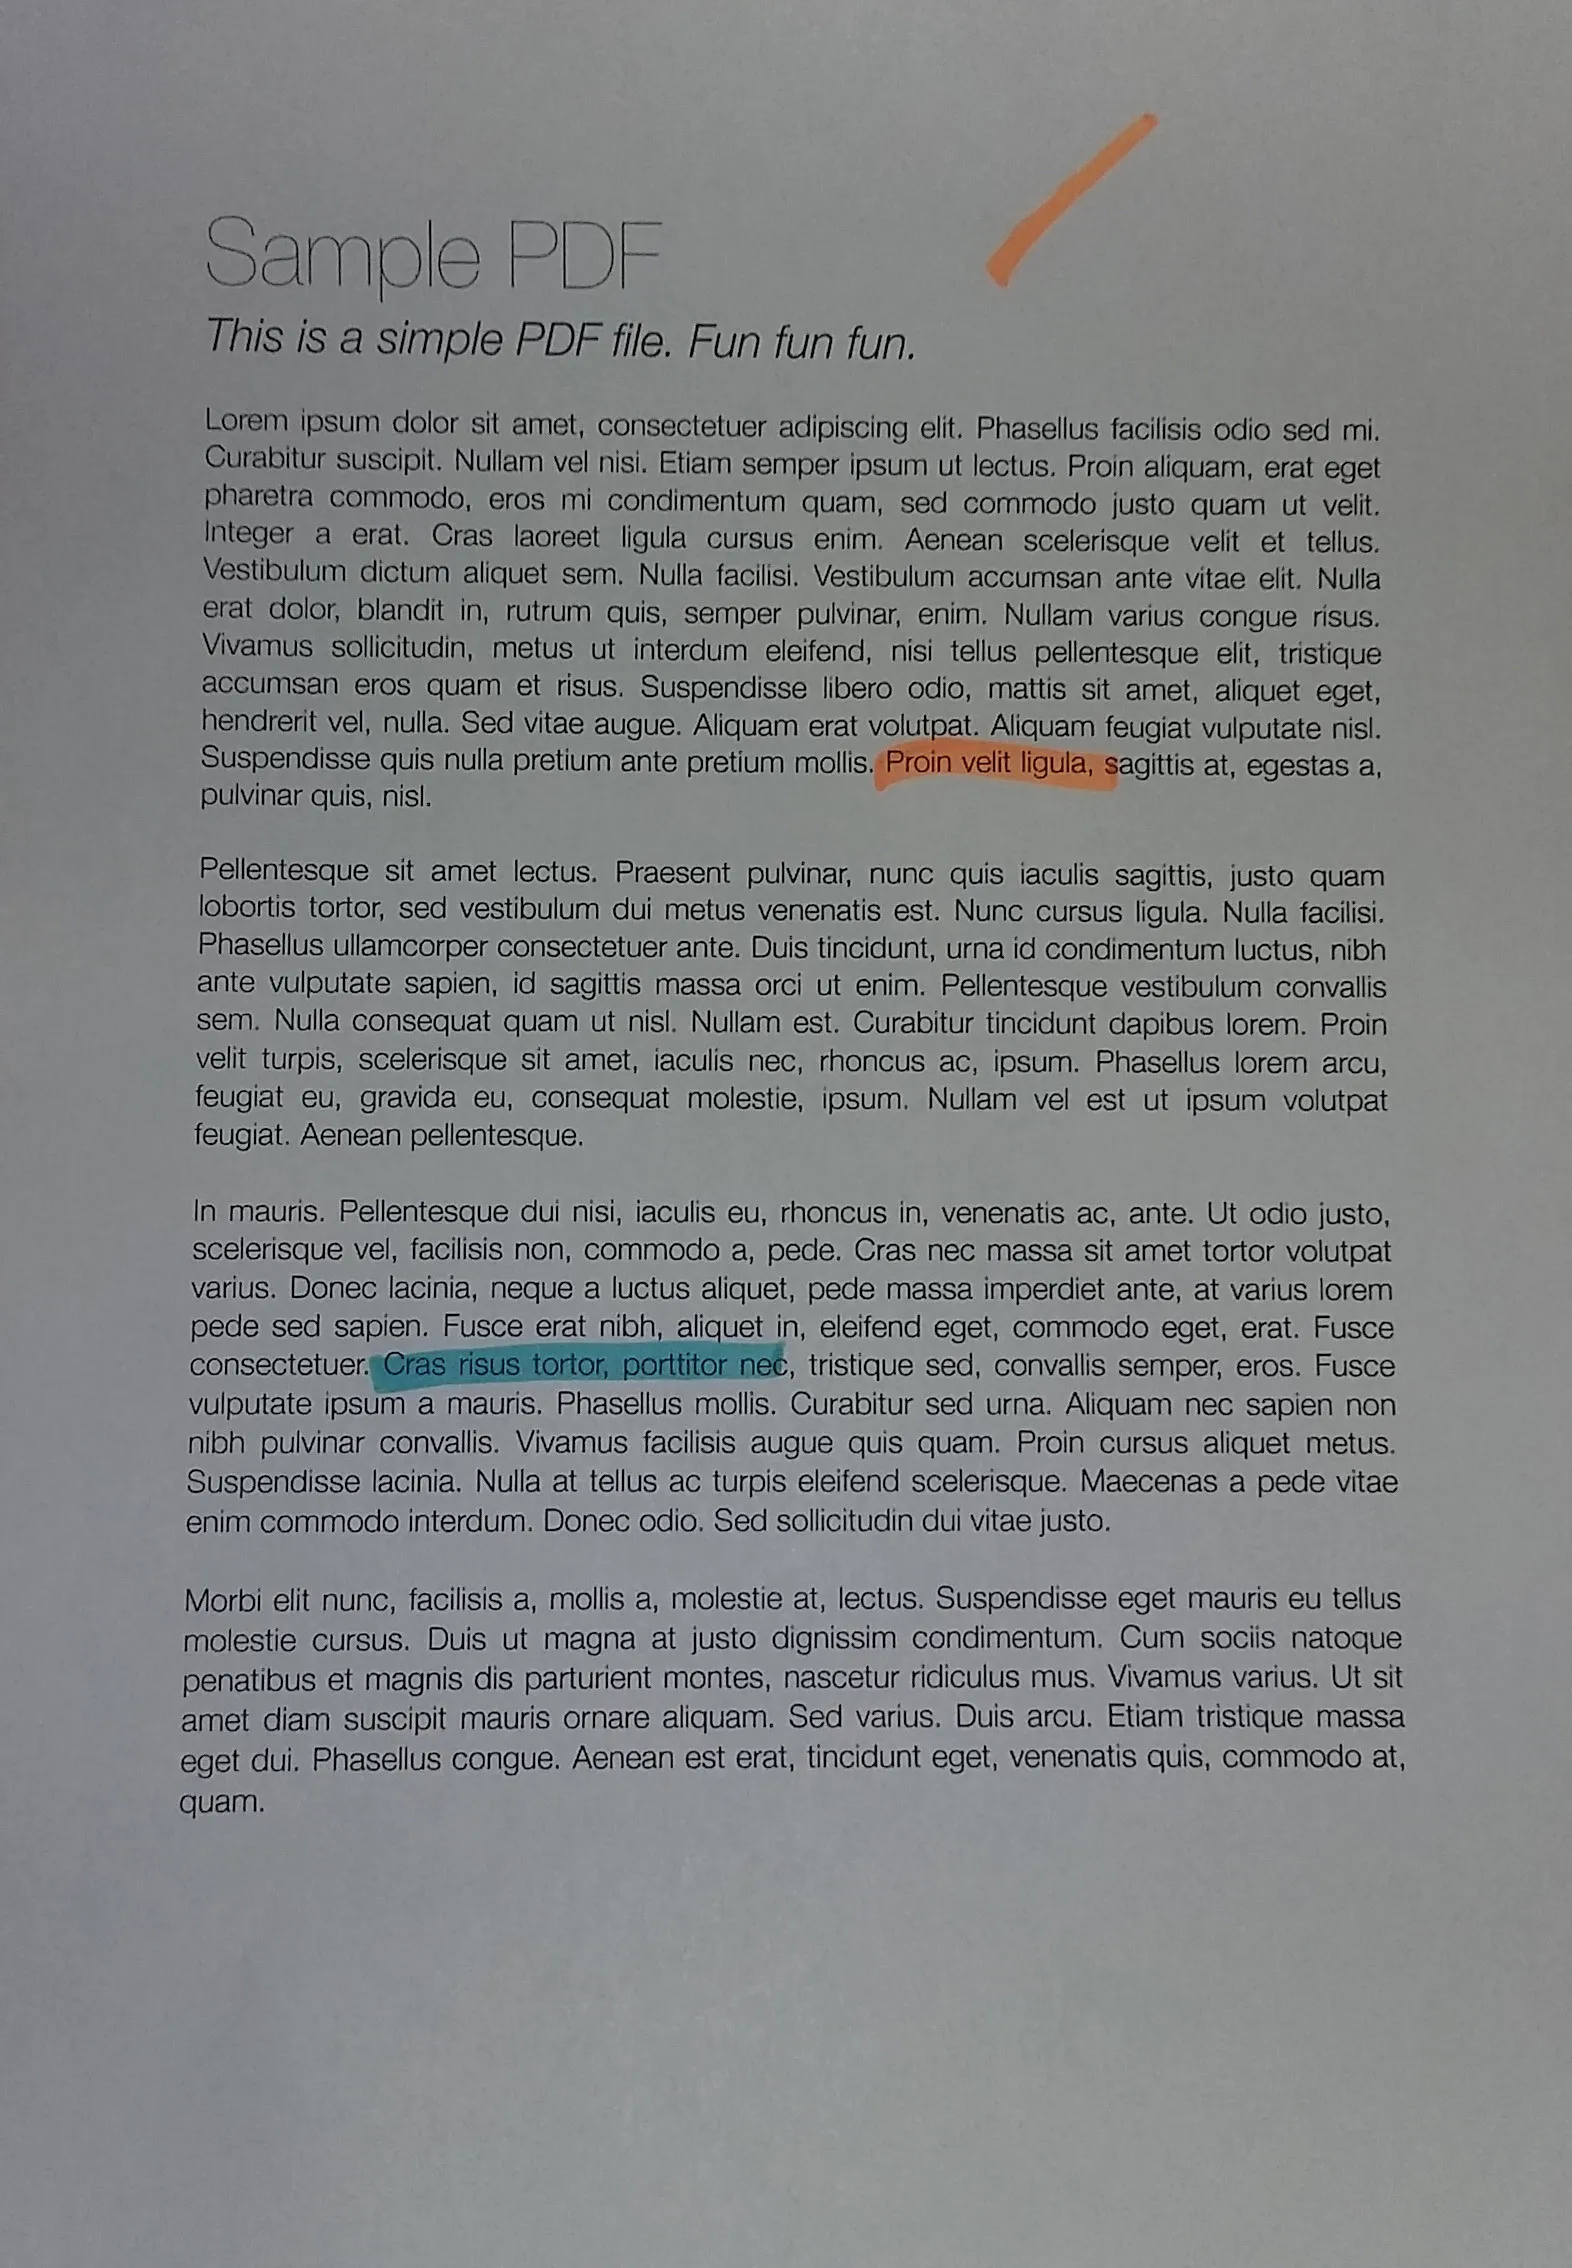
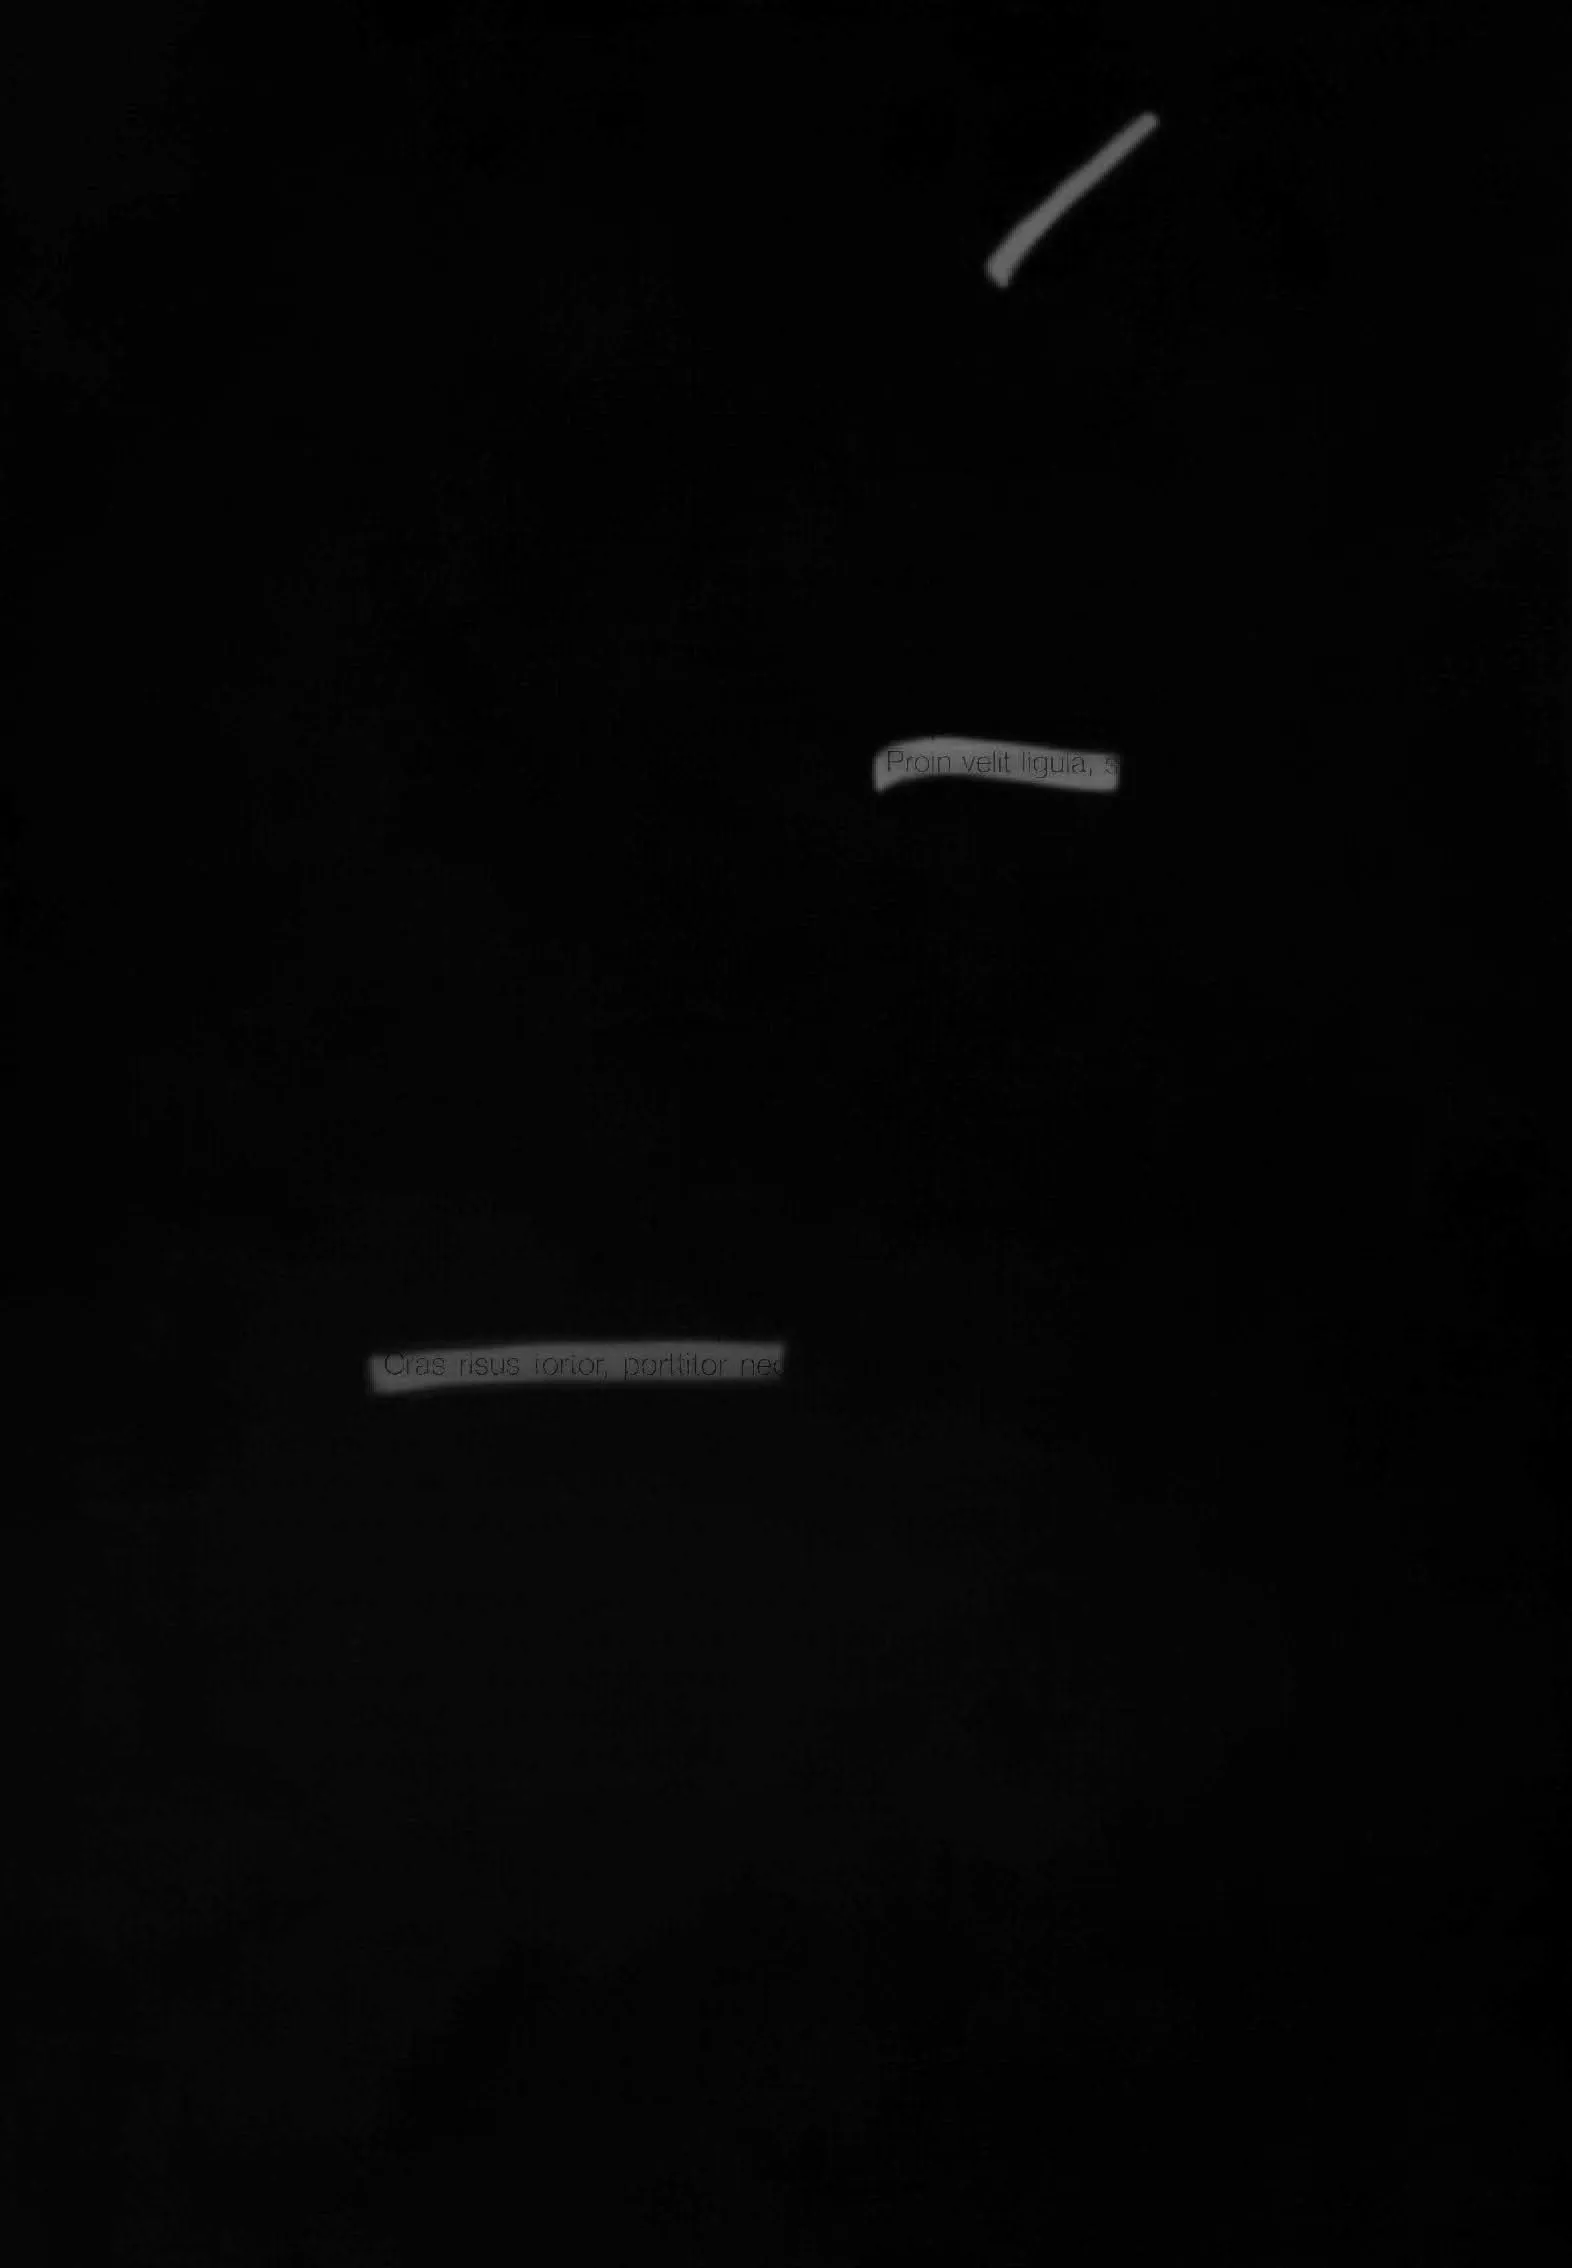
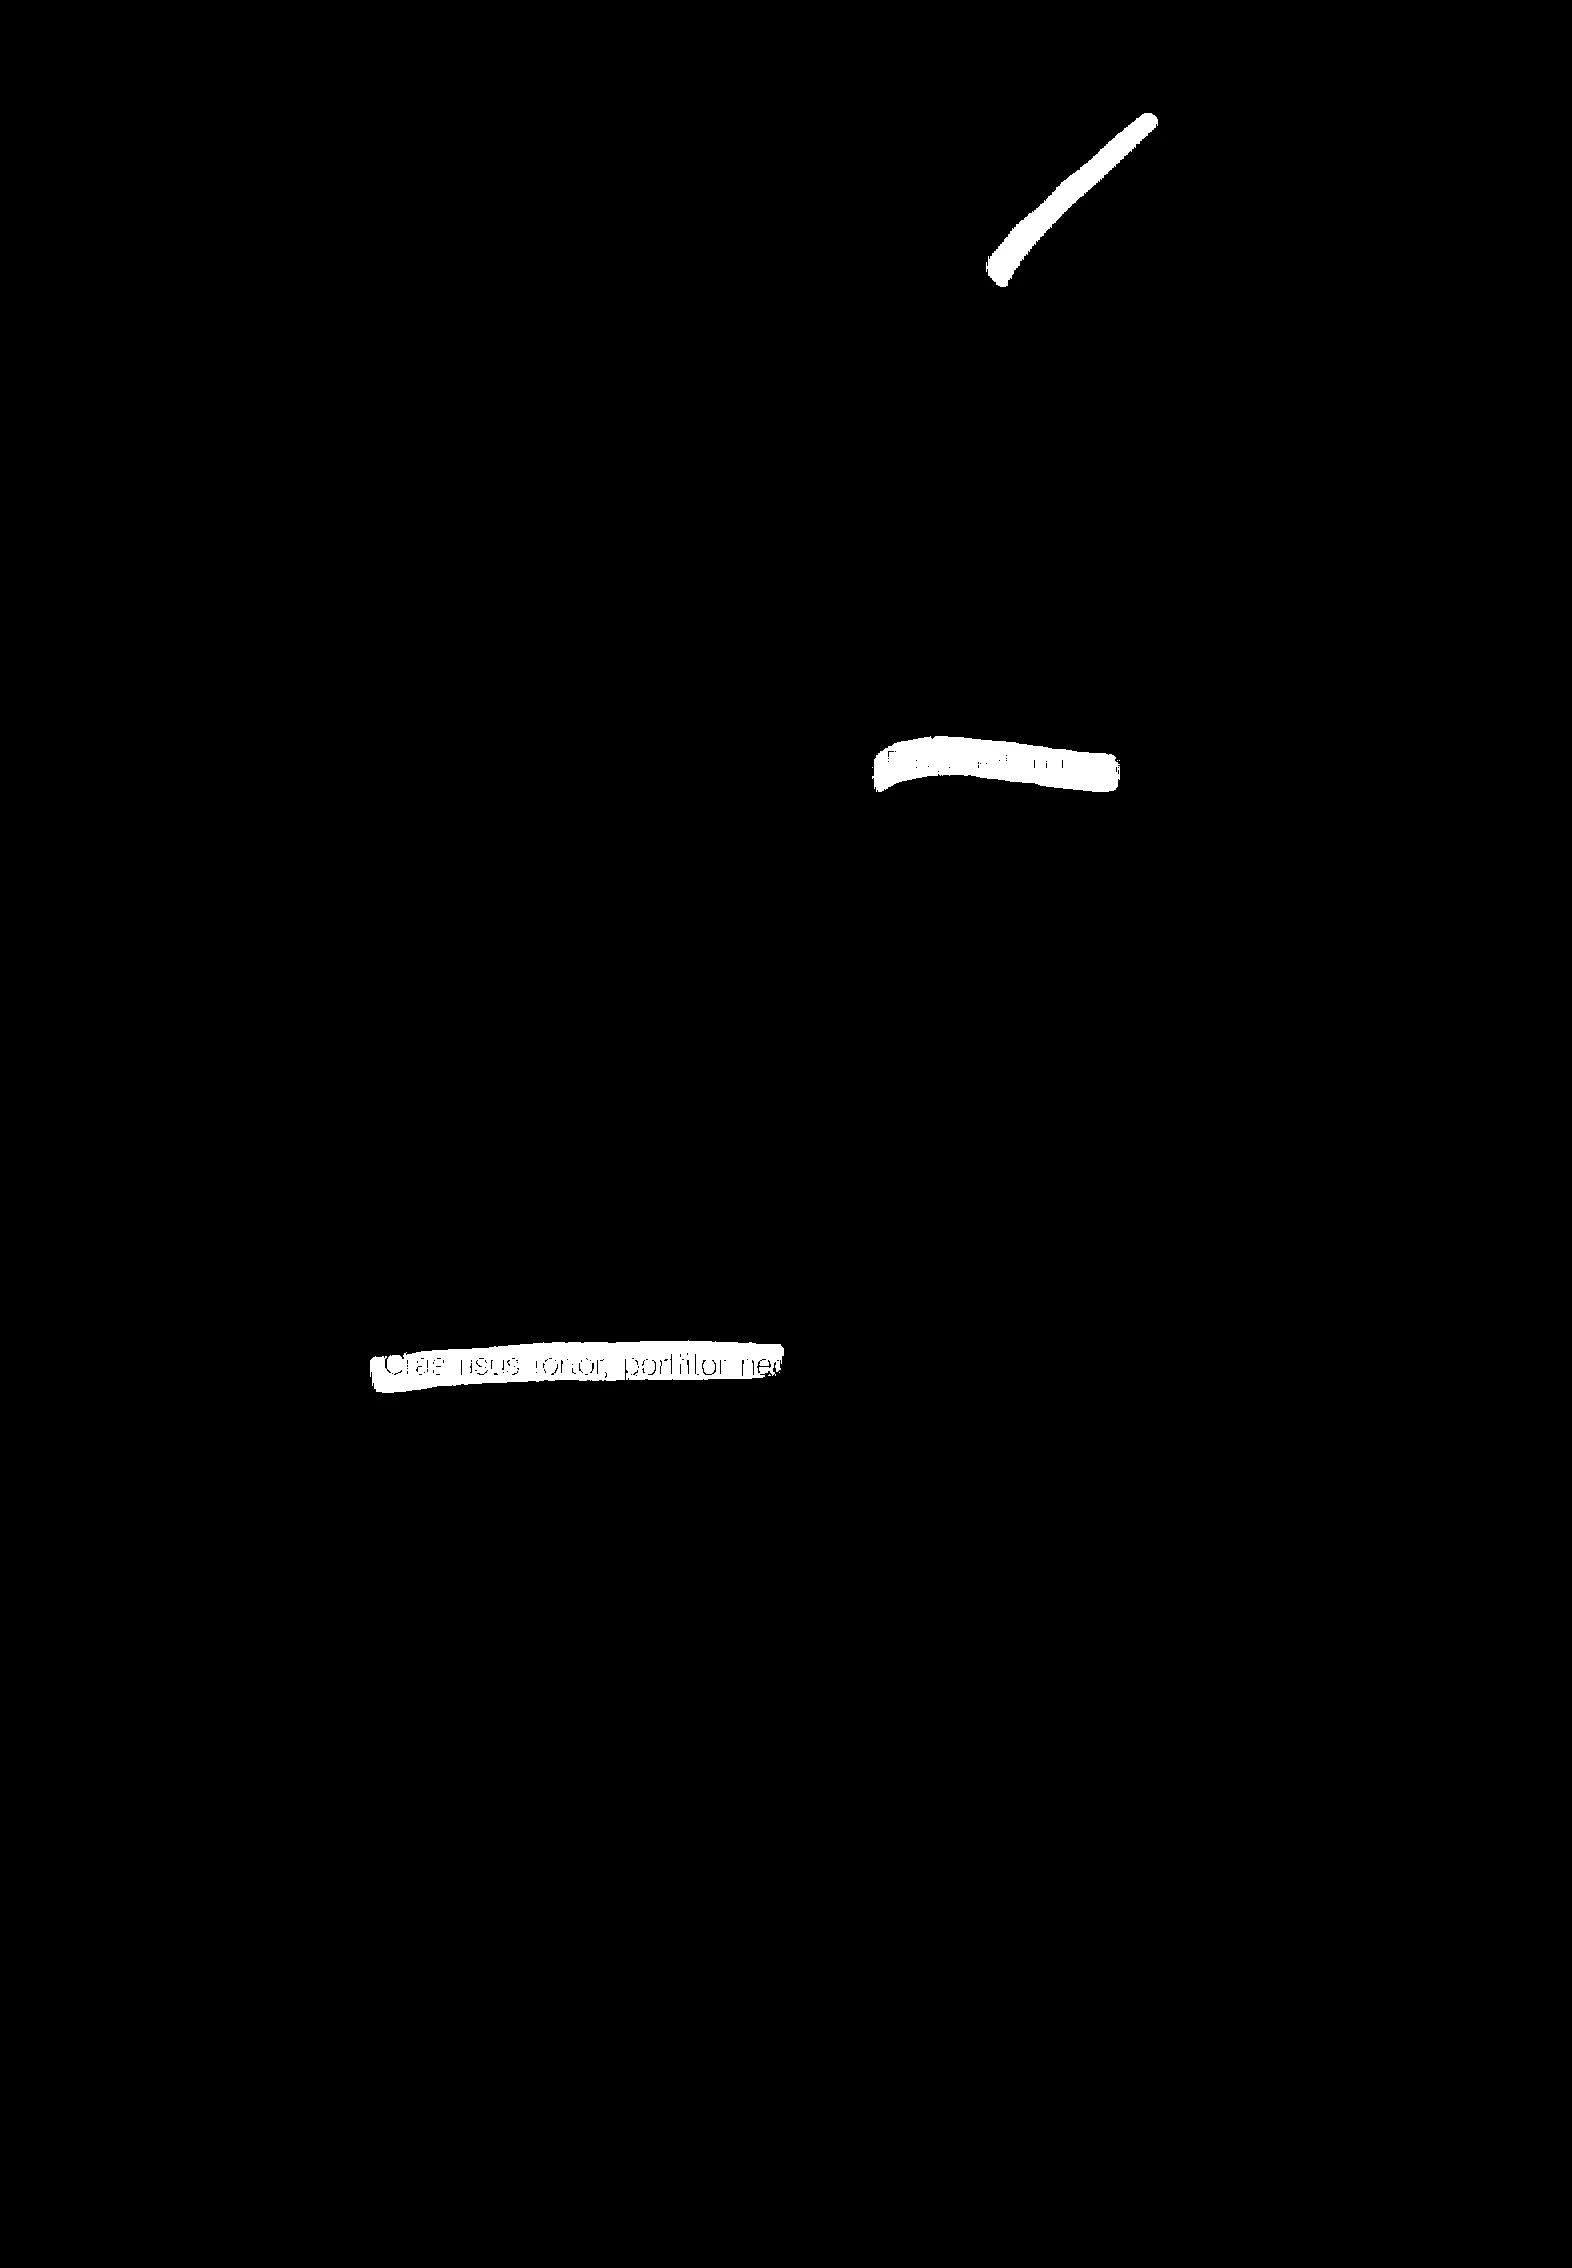
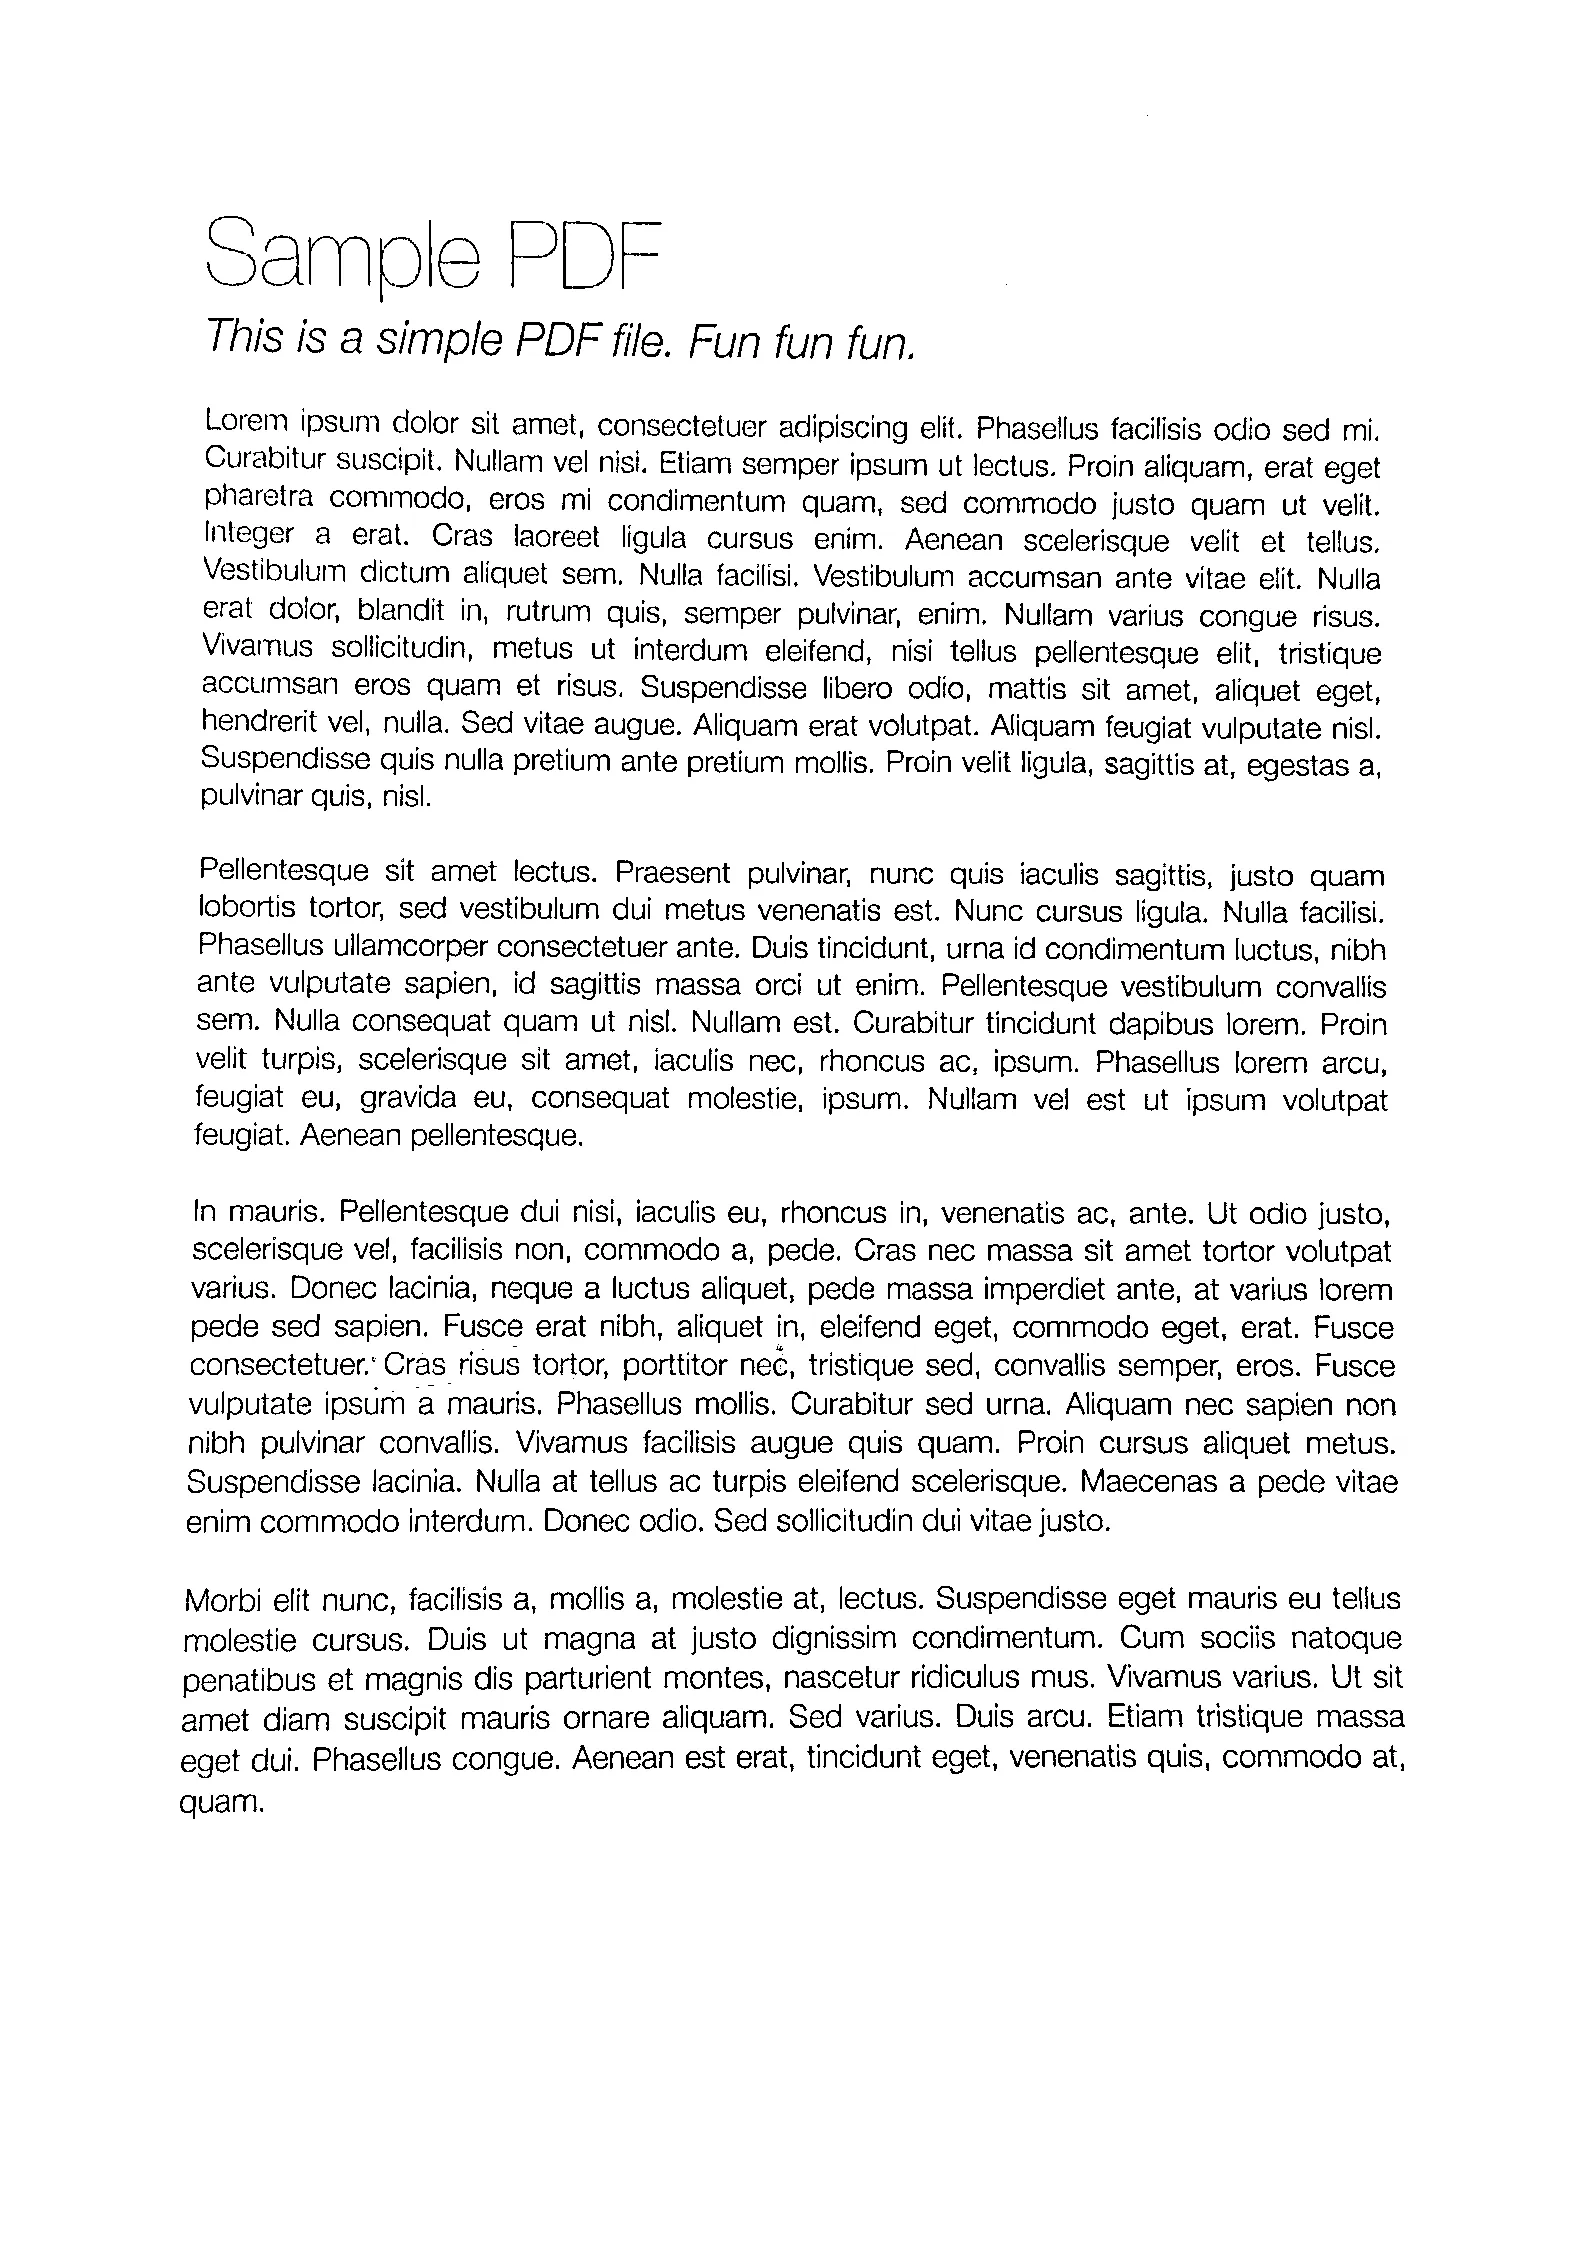
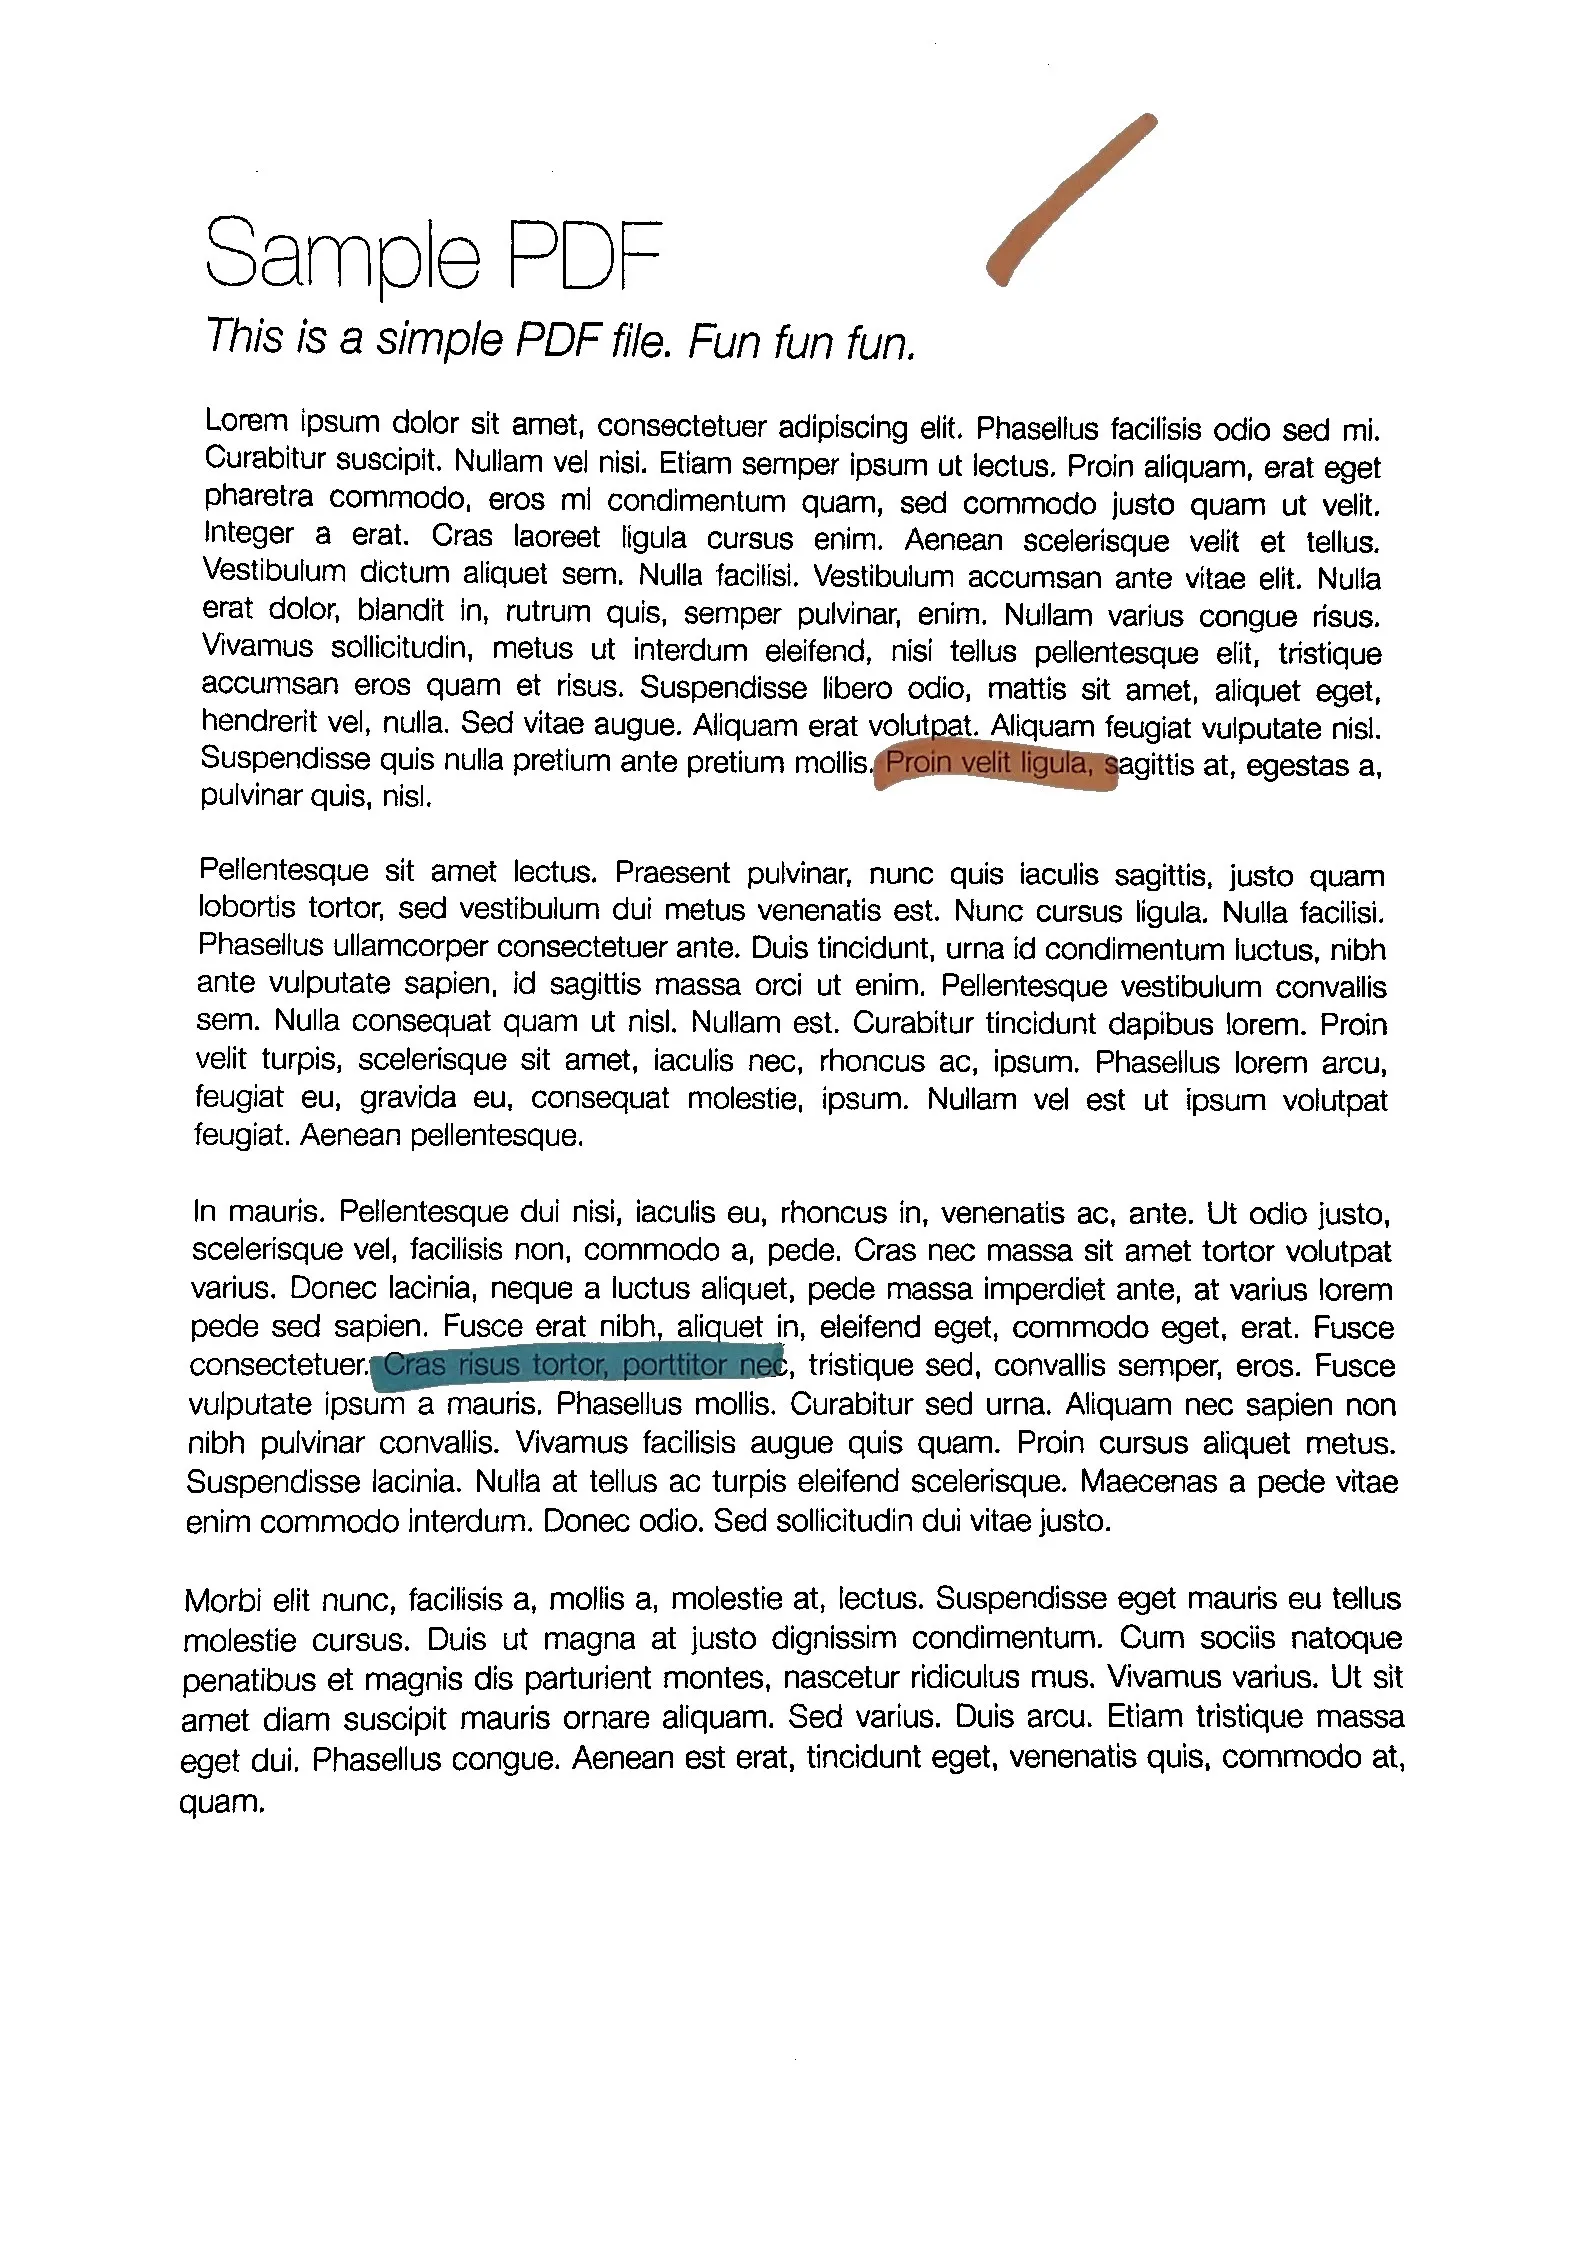
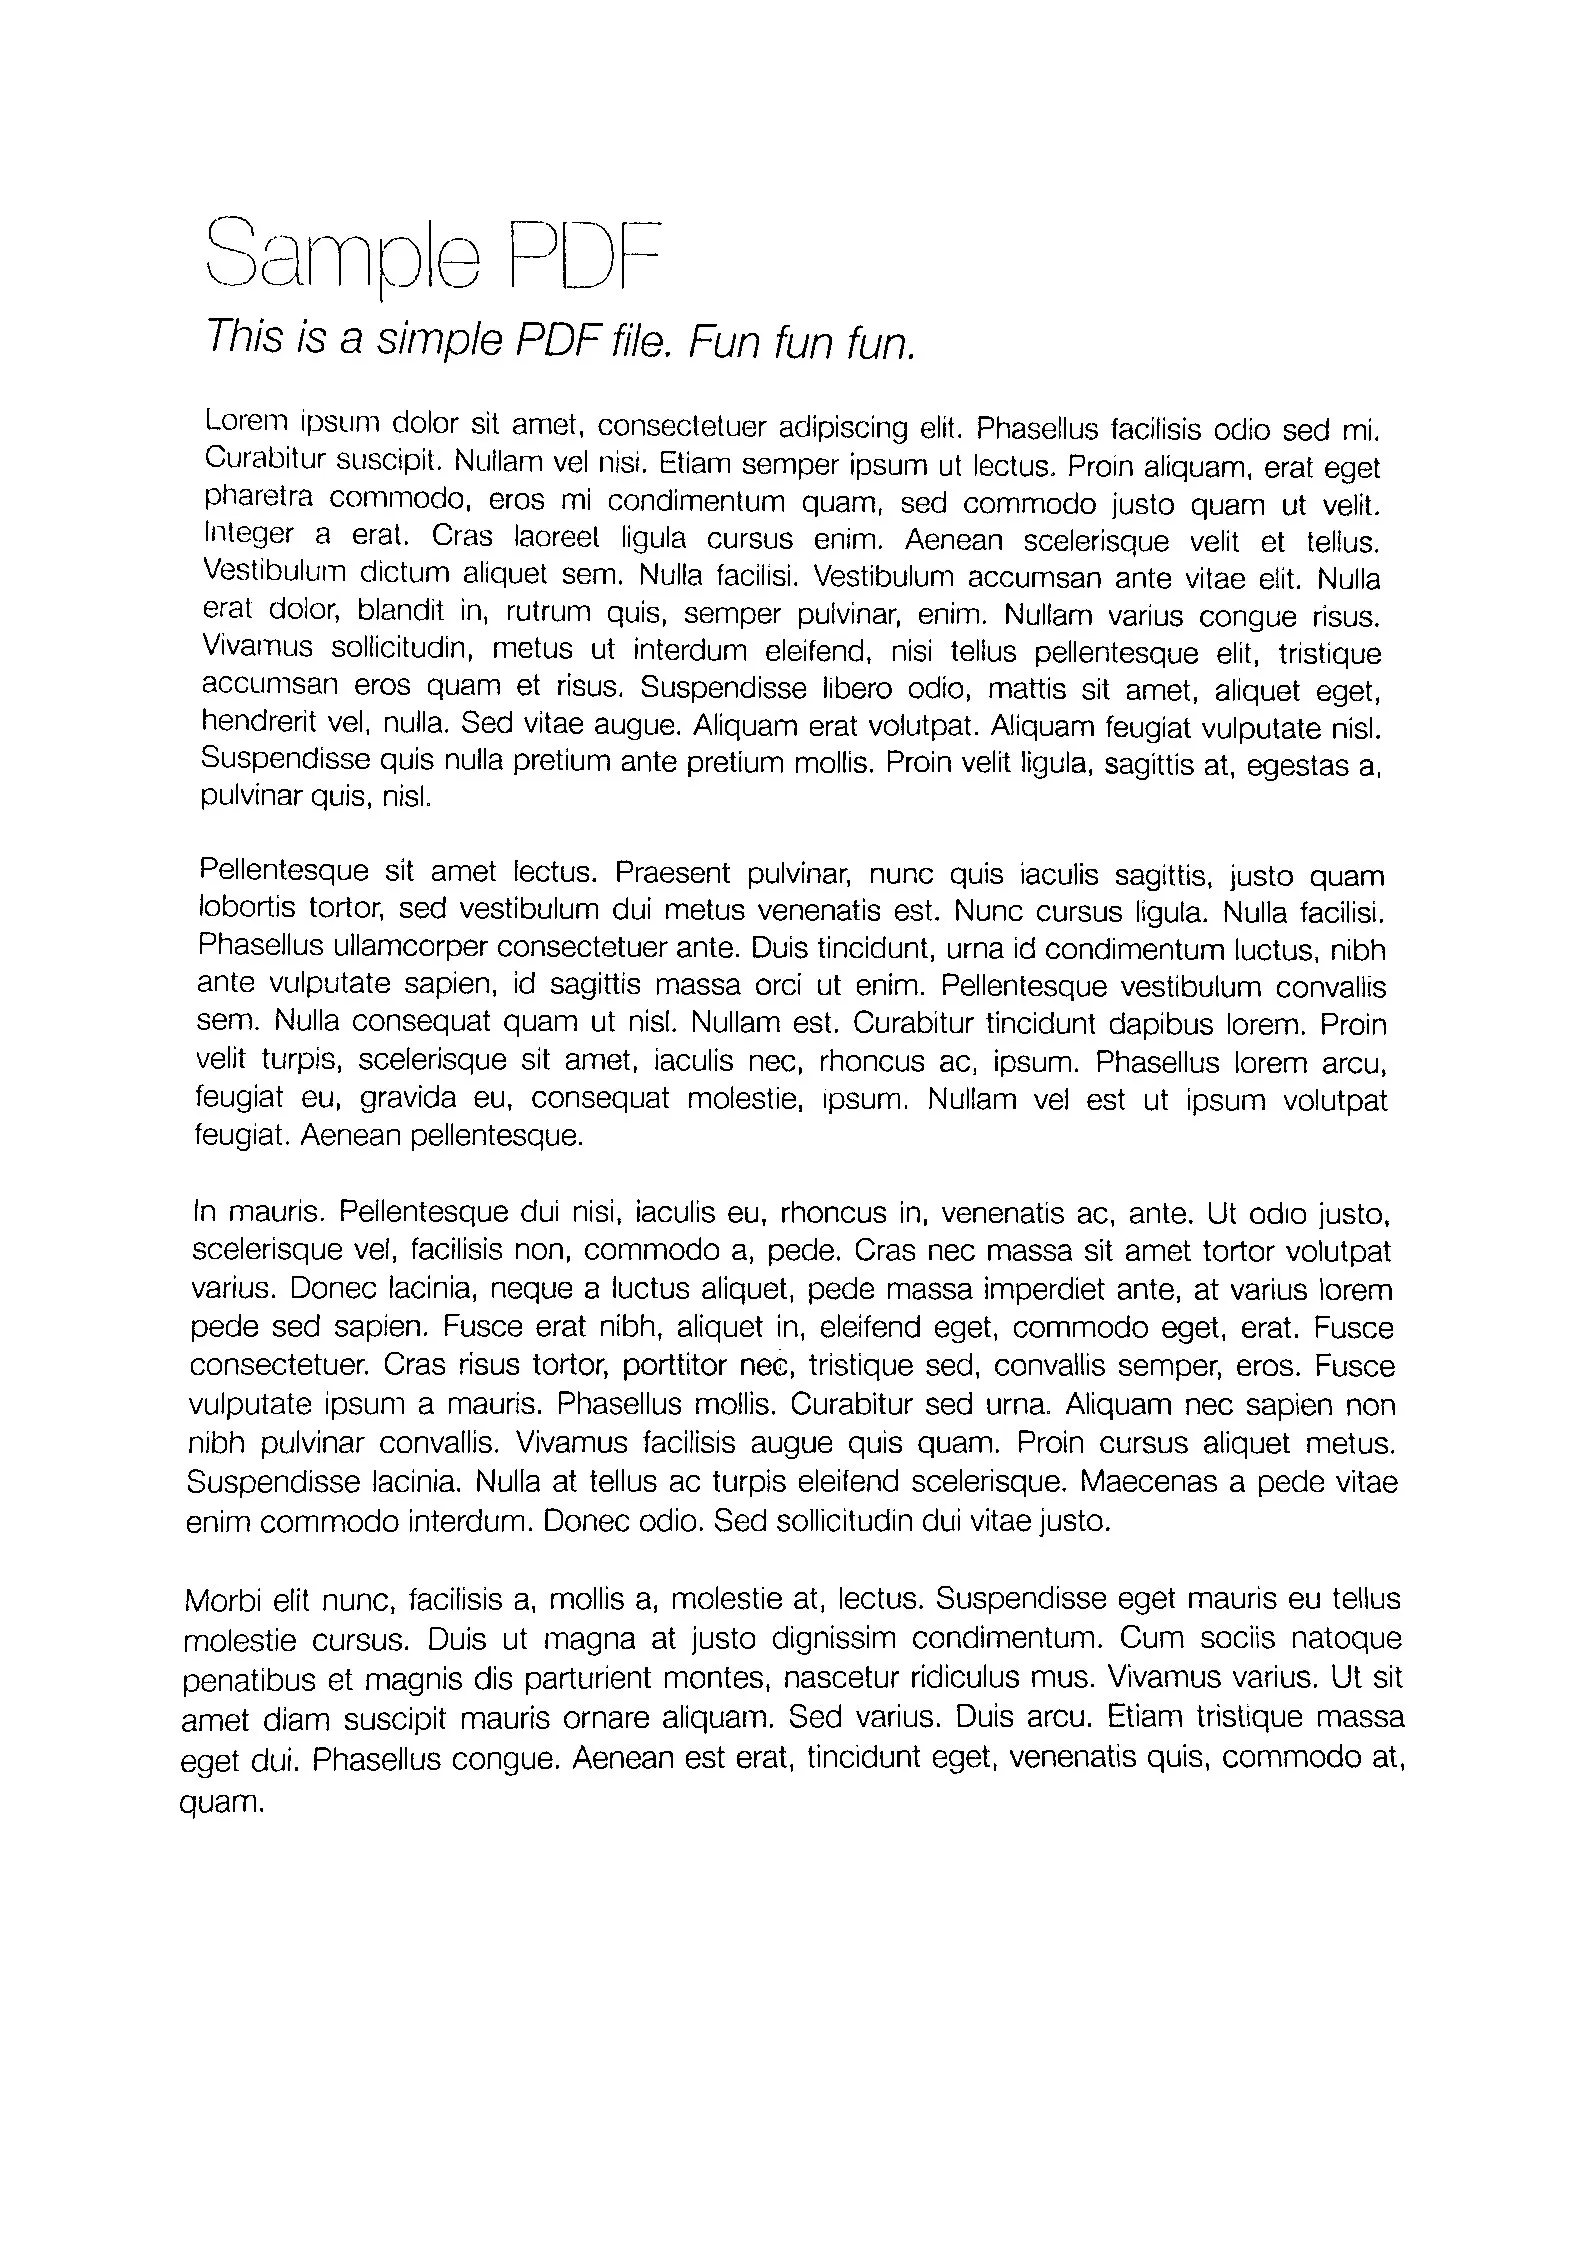
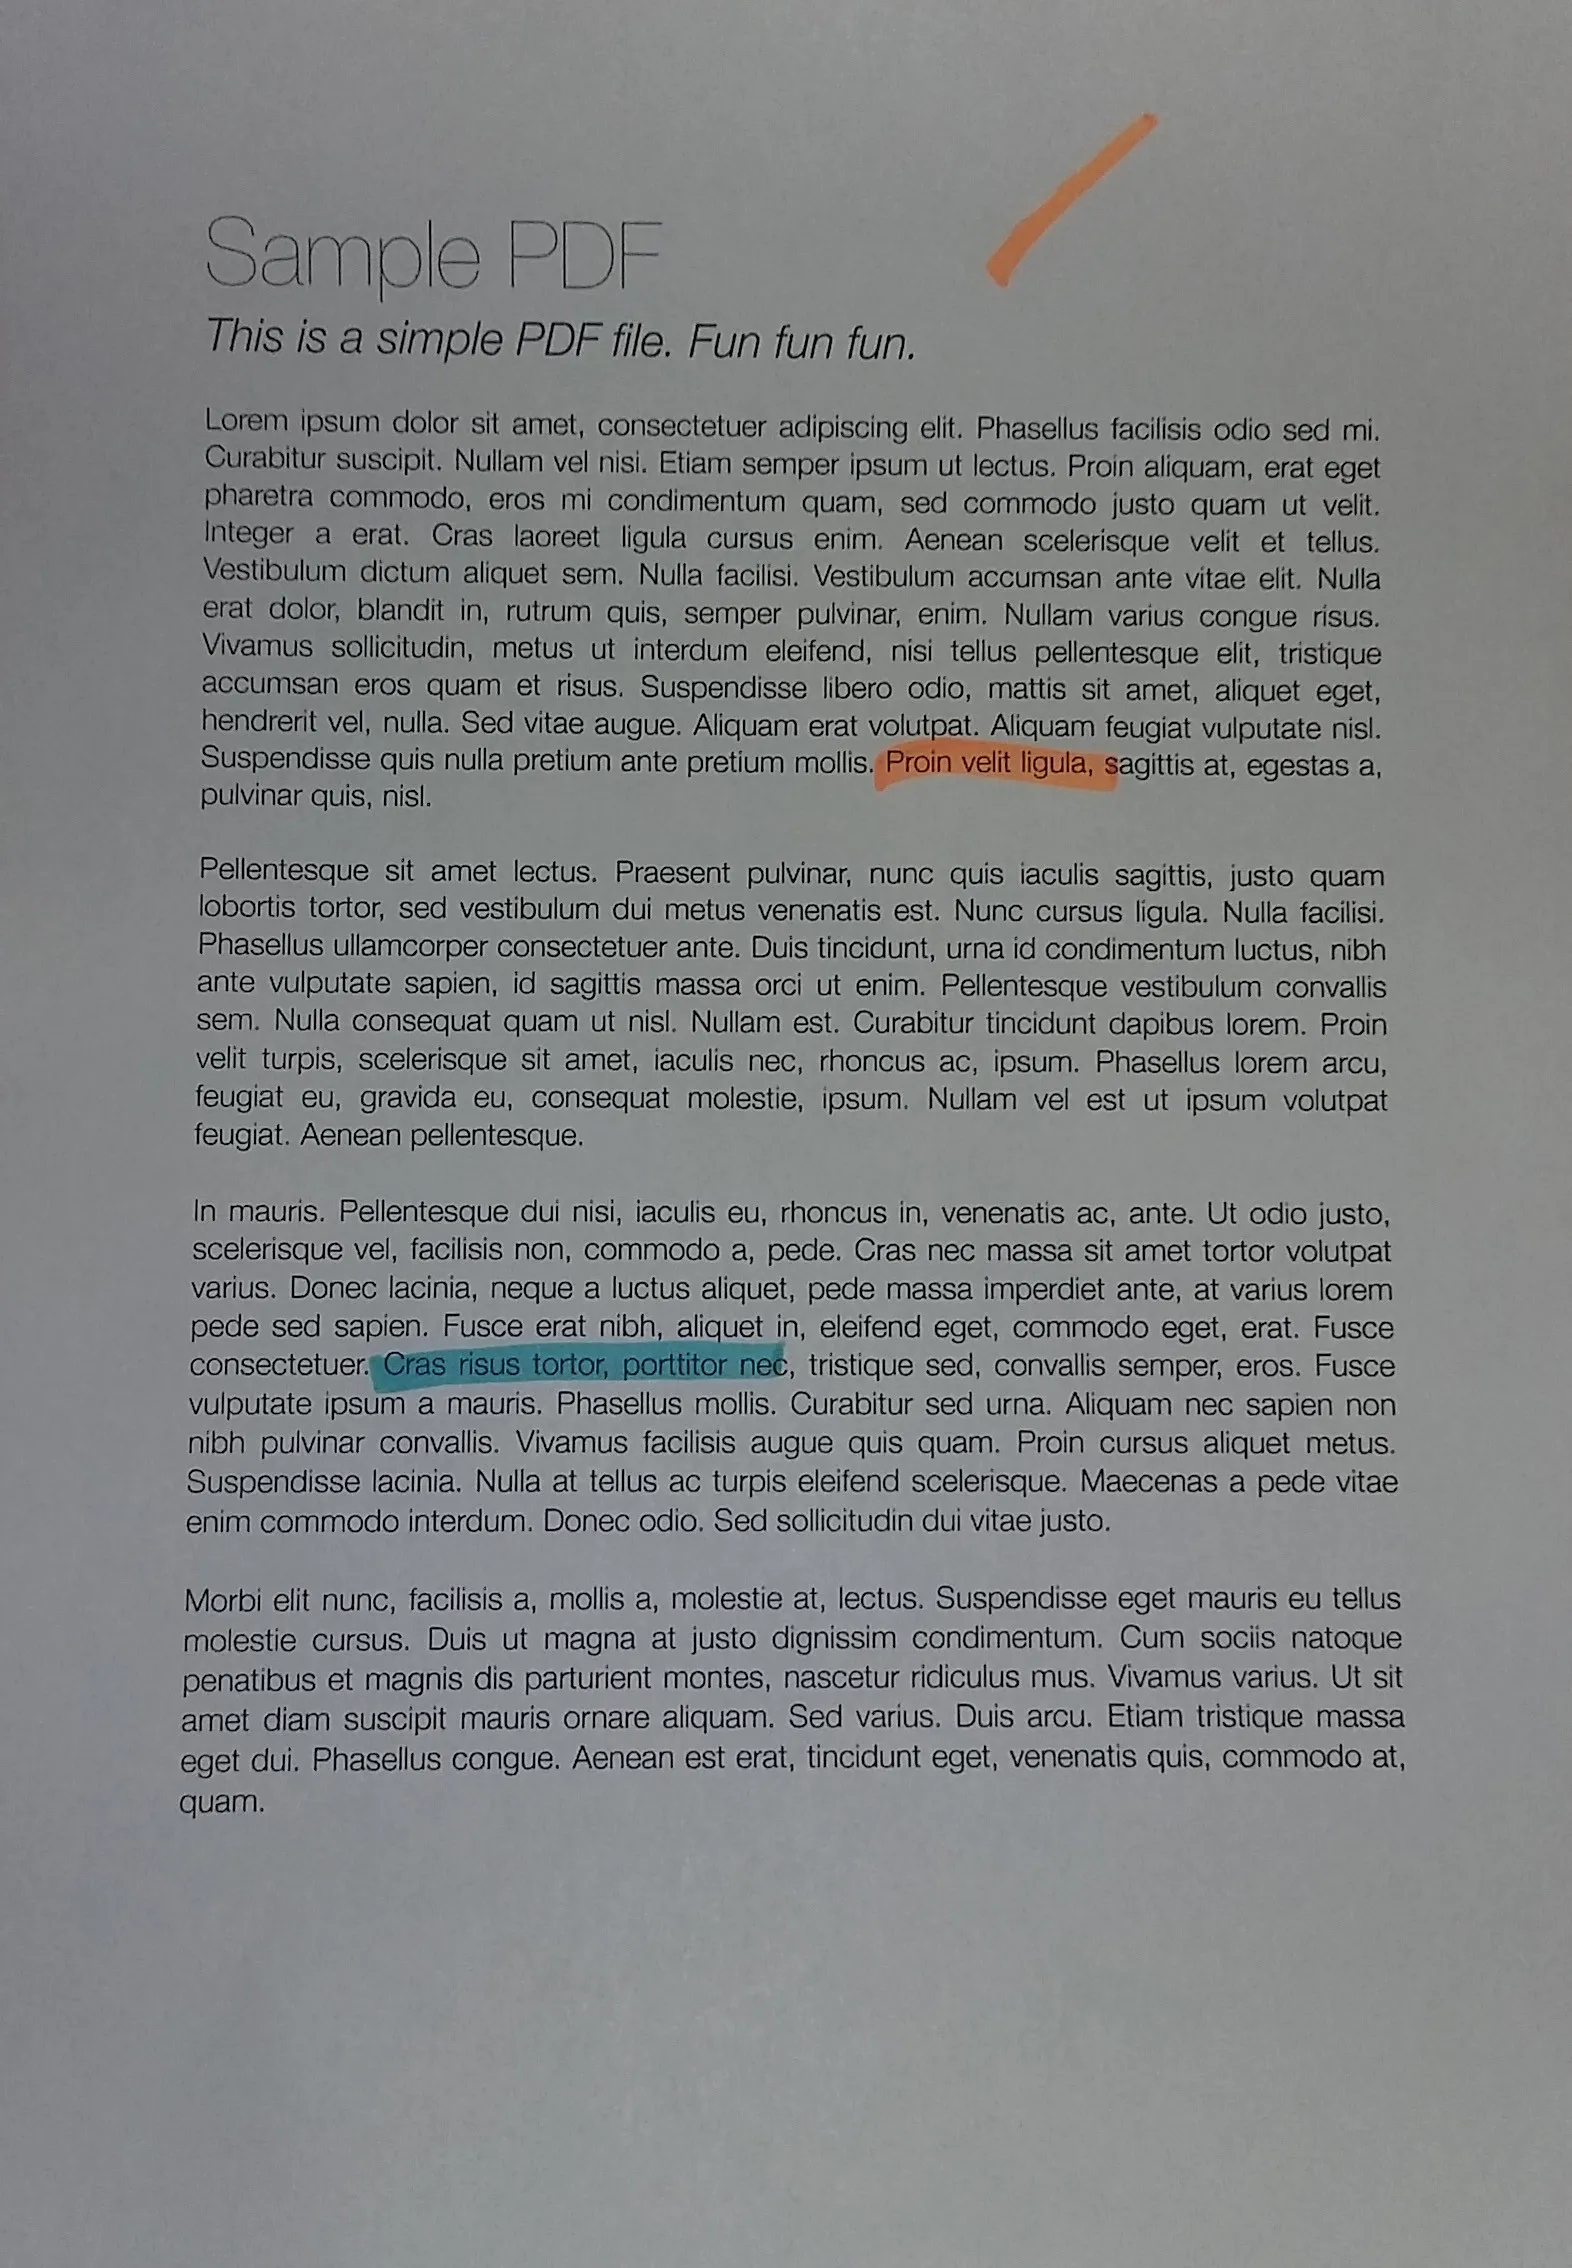
当拍摄一张纸(例如使用手机相机)时,我得到了以下结果(左图)(jpg下载此处)。期望的结果(使用图像编辑软件手动处理)在右侧:

我希望使用openCV处理原始图像,以自动获得更好的亮度/对比度(使背景更白)。
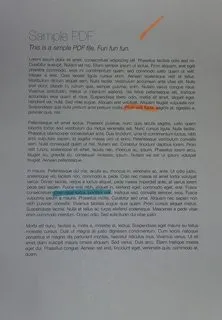
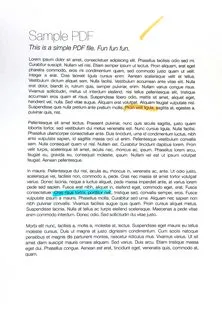
假设:图像具有A4纵向格式(我们不需要在此主题中进行透视变换),纸张是白色的,可能有黑色或彩色的文本/图像。
我尝试过的方法:
  1. Various adaptive thresholding methods such as Gaussian, OTSU (see OpenCV doc Image Thresholding). It usually works well with OTSU:

    ret, gray = cv2.threshold(img, 0, 255, cv2.THRESH_OTSU + cv2.THRESH_BINARY)
    

    but it only works for grayscale images and not directly for color images. Moreover, the output is binary (white or black), which I don't want: I prefer to keep a color non-binary image as output

  2. Histogram equalization

    • applied on Y (after RGB => YUV transform)
    • or applied on V (after RGB => HSV transform),

    as suggested by this answer (Histogram equalization not working on color image - OpenCV) or this one (OpenCV Python equalizeHist colored image):

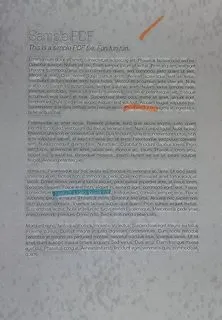
    img3 = cv2.imread(f)
    img_transf = cv2.cvtColor(img3, cv2.COLOR_BGR2YUV)
    img_transf[:,:,0] = cv2.equalizeHist(img_transf[:,:,0])
    img4 = cv2.cvtColor(img_transf, cv2.COLOR_YUV2BGR)
    cv2.imwrite('test.jpg', img4)
    

    or with HSV:

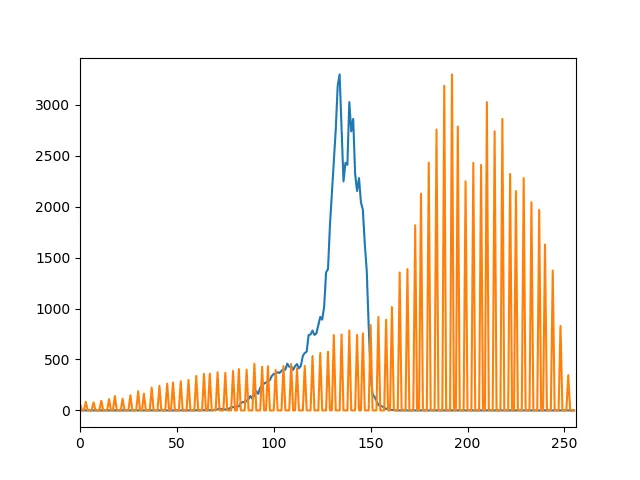
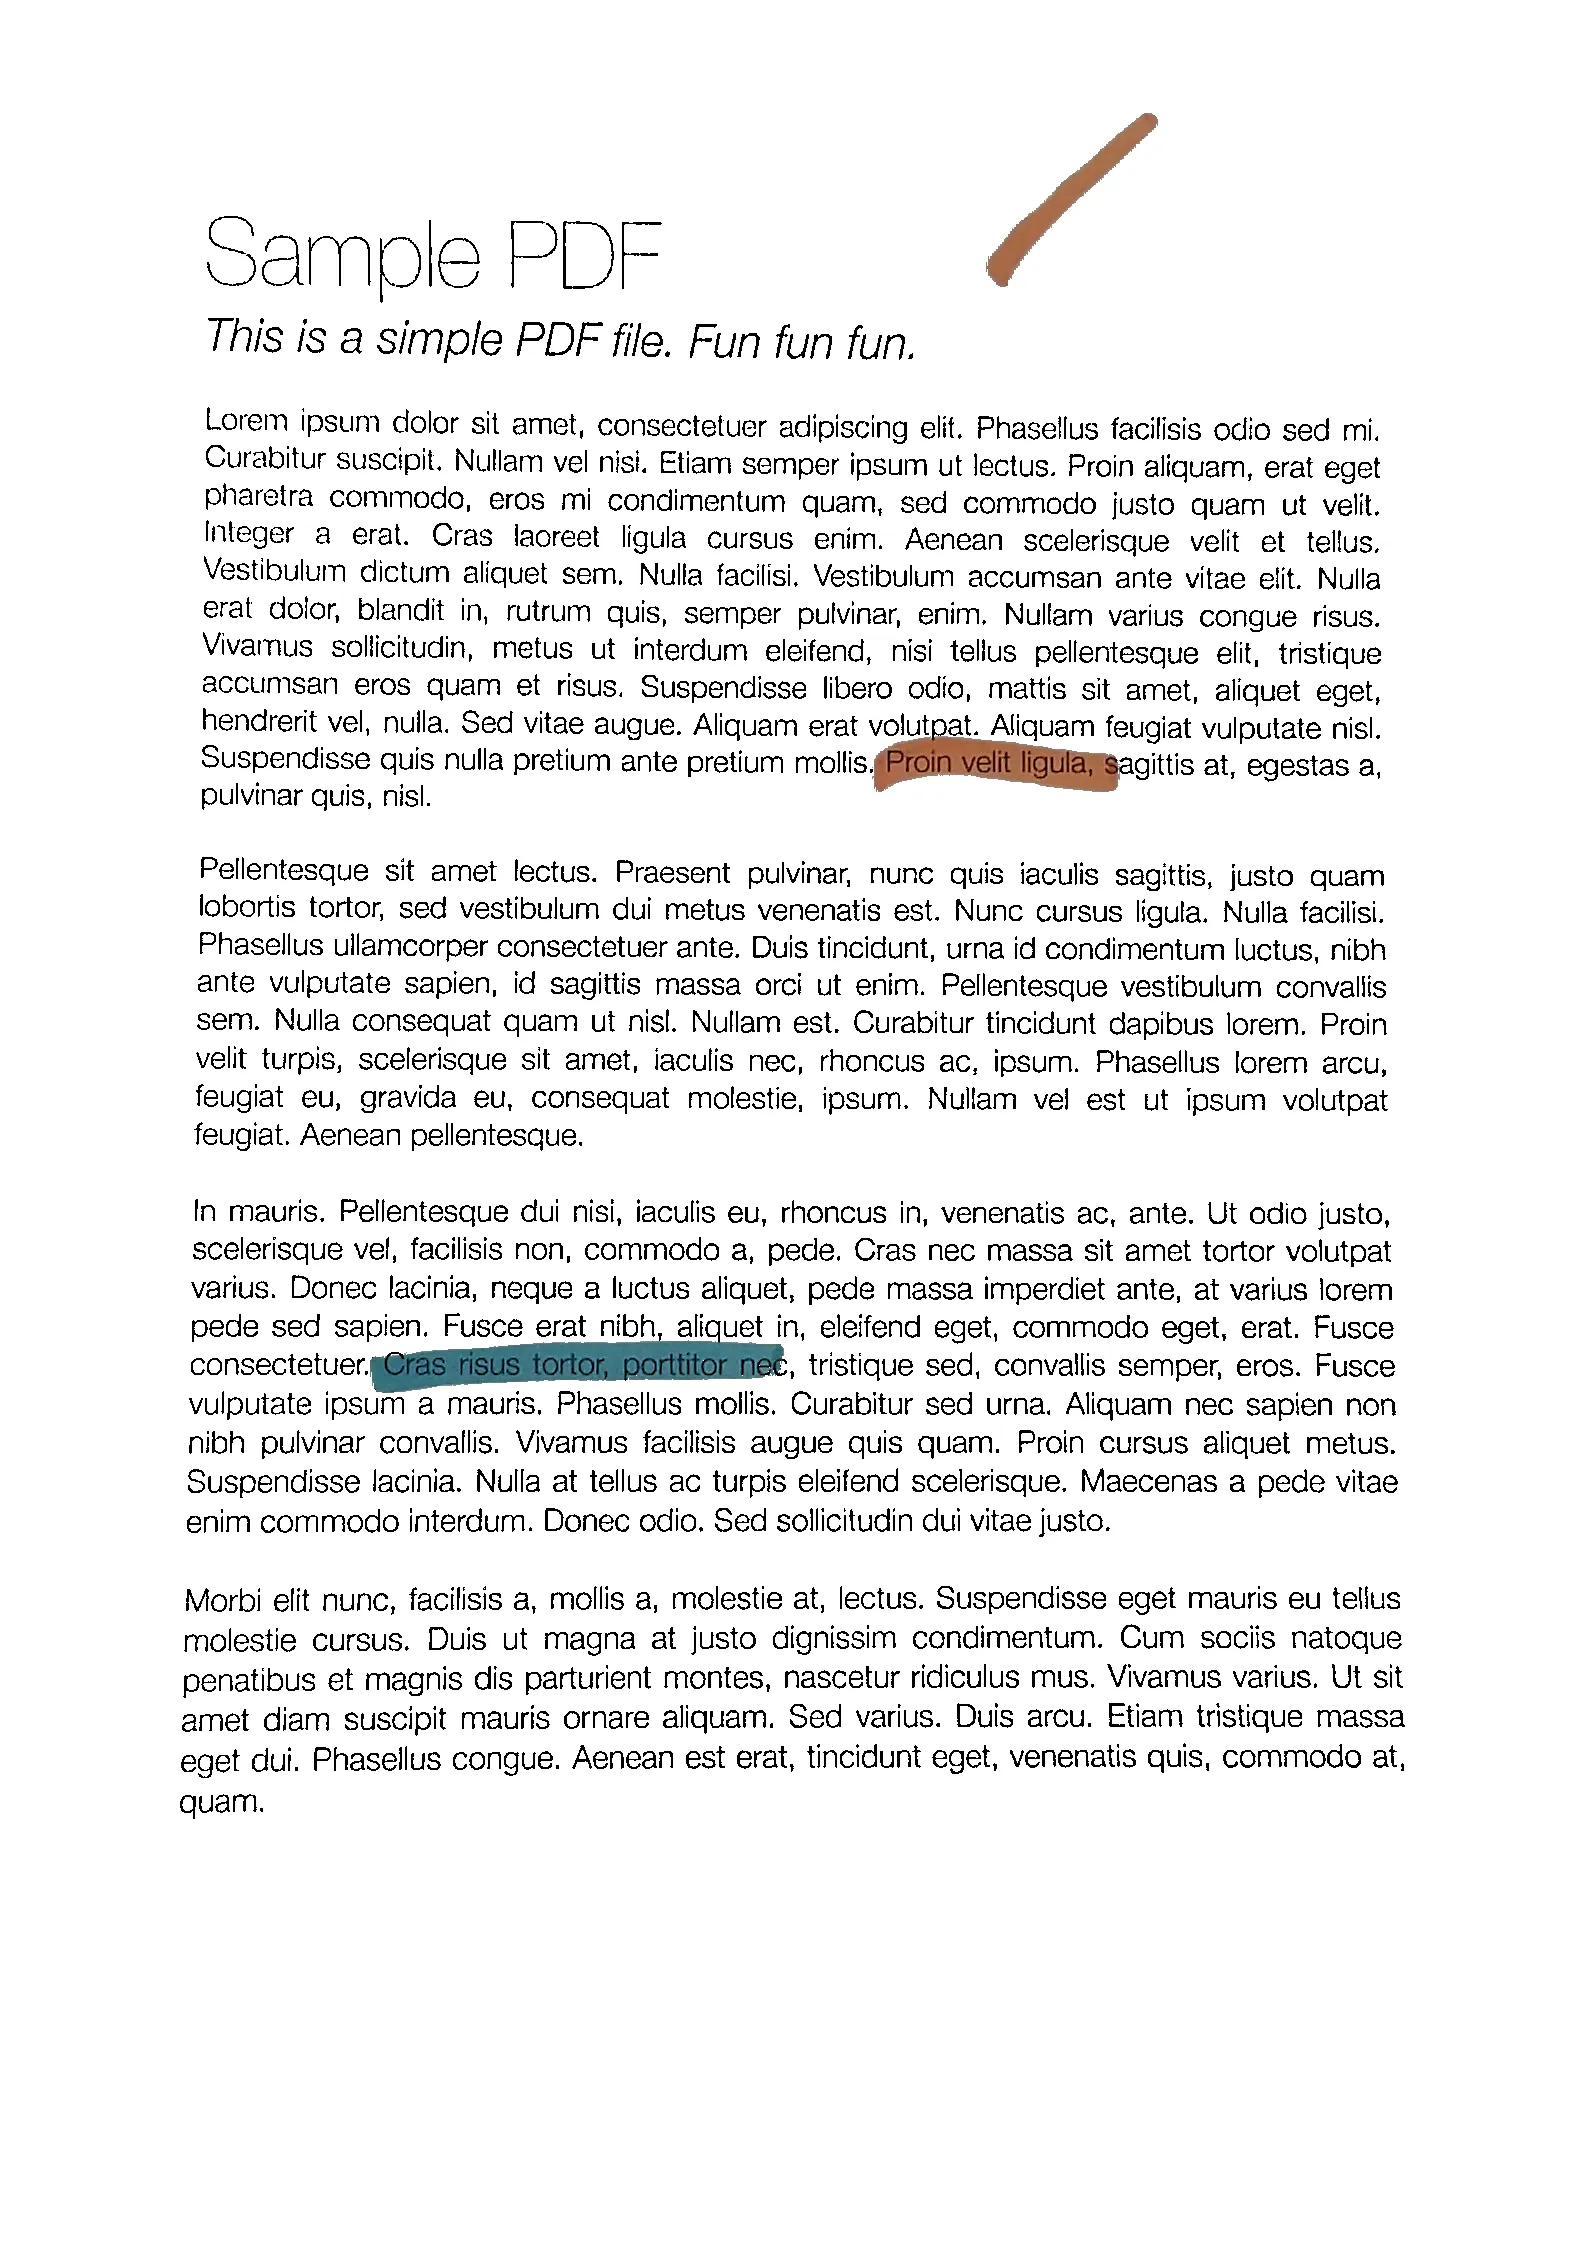
    img_transf = cv2.cvtColor(img3, cv2.COLOR_BGR2HSV)
    img_transf[:,:,2] = cv2.equalizeHist(img_transf[:,:,2])
    img4 = cv2.cvtColor(img_transf, cv2.COLOR_HSV2BGR)
    

    Unfortunately, the result is quite bad since it creates awful micro contrasts locally (?):

    I also tried YCbCr instead, and it was similar.

  3. I also tried CLAHE (Contrast Limited Adaptive Histogram Equalization) with various tileGridSize from 1 to 1000:

    img3 = cv2.imread(f)
    img_transf = cv2.cvtColor(img3, cv2.COLOR_BGR2HSV)
    clahe = cv2.createCLAHE(tileGridSize=(100,100))
    img_transf[:,:,2] = clahe.apply(img_transf[:,:,2])
    img4 = cv2.cvtColor(img_transf, cv2.COLOR_HSV2BGR)
    cv2.imwrite('test.jpg', img4)
    

    but the result was equally awful too.

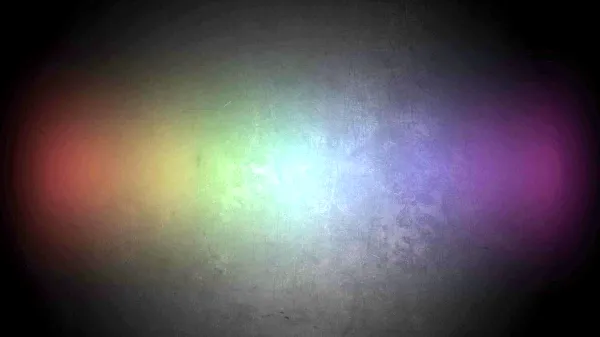
  4. Doing this CLAHE method with LAB color space, as suggested in the question How to apply CLAHE on RGB color images:

    import cv2, numpy as np
    bgr = cv2.imread('_example.jpg')
    lab = cv2.cvtColor(bgr, cv2.COLOR_BGR2LAB)
    lab_planes = cv2.split(lab)
    clahe = cv2.createCLAHE(clipLimit=2.0,tileGridSize=(100,100))
    lab_planes[0] = clahe.apply(lab_planes[0])
    lab = cv2.merge(lab_planes)
    bgr = cv2.cvtColor(lab, cv2.COLOR_LAB2BGR)
    cv2.imwrite('_example111.jpg', bgr)
    

    gave bad result too. Output image:

  5. Do an adaptive thresholding or histogram equalization separately on each channel (R, G, B) is not an option since it would mess with the color balance, as explained here.

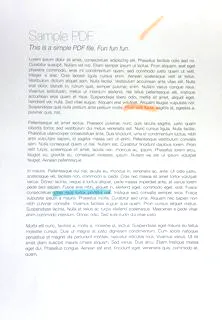
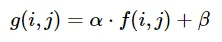
  6. "Contrast strechting" method from scikit-image's tutorial on Histogram Equalization:

    the image is rescaled to include all intensities that fall within the 2nd and 98th percentiles

    is a little bit better, but still far from the desired result (see image on top of this question).


TL;DR:如何使用OpenCV/Python对彩色纸张照片进行自动亮度/对比度优化?可以使用什么样的阈值处理/直方图均衡化/其他技术?

如何将阈值处理和重新缩放结合起来呢?我的意思是,使用阈值处理,但使用8(或16)级别(而不是二进制阈值),然后将其重新缩放回256个亮度级别?因为这是一张彩色图像,你可以尝试对每个颜色通道进行处理。 - AcaNg
感谢@Tiendung的想法。如何自动找到最佳的8或16个级别(无需为每个图像手动设置参数),类似于OTSU?这难道不是与直方图均衡化更或多少相似吗?您能否发布一个Python示例代码,以便我们可以尝试您的建议? - Basj
@CrisLuengo 不,这与JPEG压缩伪影无关(根据我的测试)。 - Basj
我对你使用CLAHE的结果感到有些不满意。你是否尝试有效地调整参数? - Rick M.
代码收藏:https://github.com/milahu/document-photo-auto-threshold - milahu
显示剩余5条评论
6个回答

87

在此输入图片描述 在此输入图片描述

可以使用 alpha (α) 和 beta (β) 来调整对比度和亮度,这些变量通常被称为增益和偏差参数。表达式可以写成

在此输入图片描述

OpenCV 已经将其实现为 cv2.convertScaleAbs(),因此我们可以使用用户定义的 alpha 和 beta 值来调用此函数。

import cv2

image = cv2.imread('1.jpg')

alpha = 1.95 # Contrast control (1.0-3.0)
beta = 0 # Brightness control (0-100)

manual_result = cv2.convertScaleAbs(image, alpha=alpha, beta=beta)

cv2.imshow('original', image)
cv2.imshow('manual_result', manual_result)
cv2.waitKey()

但问题是:

如何自动优化彩色照片的亮度/对比度?

本质上,问题是如何自动计算 alphabeta。为了做到这一点,我们可以查看图像的直方图。自动亮度和对比度优化会计算出 alpha 和 beta,使输出范围为 [0 ... 255]。我们通过计算累积分布来确定颜色频率小于某个阈值(例如1%)的位置,并剪切直方图的右侧和左侧。这给我们最小和最大范围。下面是在剪辑之前(蓝色)和之后(橙色)的直方图可视化效果。请注意,在剪辑之后,图像的更“有趣”的部分更加突出。

要计算 alpha,我们需要在剪裁后取最小和最大灰度范围,并将其从我们所需的输出范围 255 中除以。

α = 255 / (maximum_gray - minimum_gray)

为了计算 Beta 值,我们将其带入公式中,其中 g(i, j)=0f(i, j)=minimum_gray

g(i,j) = α * f(i,j) + β

解决后得到以下结果

β = -minimum_gray * α

针对您的图片,我们得到如下结果:

Alpha值: 3.75

Beta值: -311.25

您可能需要调整截断阈值以优化结果。以下是使用1%阈值的其他图像的示例结果:Before -> After

自动亮度和对比度代码

import cv2
import numpy as np
from matplotlib import pyplot as plt

# Automatic brightness and contrast optimization with optional histogram clipping
def automatic_brightness_and_contrast(image, clip_hist_percent=1):
    gray = cv2.cvtColor(image, cv2.COLOR_BGR2GRAY)
    
    # Calculate grayscale histogram
    hist = cv2.calcHist([gray],[0],None,[256],[0,256])
    hist_size = len(hist)
    
    # Calculate cumulative distribution from the histogram
    accumulator = []
    accumulator.append(float(hist[0]))
    for index in range(1, hist_size):
        accumulator.append(accumulator[index -1] + float(hist[index]))
    
    # Locate points to clip
    maximum = accumulator[-1]
    clip_hist_percent *= (maximum/100.0)
    clip_hist_percent /= 2.0
    
    # Locate left cut
    minimum_gray = 0
    while accumulator[minimum_gray] < clip_hist_percent:
        minimum_gray += 1
    
    # Locate right cut
    maximum_gray = hist_size -1
    while accumulator[maximum_gray] >= (maximum - clip_hist_percent):
        maximum_gray -= 1
    
    # Calculate alpha and beta values
    alpha = 255 / (maximum_gray - minimum_gray)
    beta = -minimum_gray * alpha
    
    '''
    # Calculate new histogram with desired range and show histogram 
    new_hist = cv2.calcHist([gray],[0],None,[256],[minimum_gray,maximum_gray])
    plt.plot(hist)
    plt.plot(new_hist)
    plt.xlim([0,256])
    plt.show()
    '''

    auto_result = cv2.convertScaleAbs(image, alpha=alpha, beta=beta)
    return (auto_result, alpha, beta)

image = cv2.imread('1.jpg')
auto_result, alpha, beta = automatic_brightness_and_contrast(image)
print('alpha', alpha)
print('beta', beta)
cv2.imshow('auto_result', auto_result)
cv2.waitKey()

使用此代码的结果图像:

输入图像描述

使用1%阈值的其他图像结果

输入图像描述 输入图像描述

输入图像描述 输入图像描述

另一种方法是使用饱和算术向图像添加增益偏差,而不是使用OpenCV的cv2.convertScaleAbs()。内置方法不会取绝对值,这将导致荒谬的结果(例如,当alpha = 3且beta = -210的像素变为OpenCV中的78时,实际上应该变为0)。

import cv2
import numpy as np
# from matplotlib import pyplot as plt

def convertScale(img, alpha, beta):
    """Add bias and gain to an image with saturation arithmetics. Unlike
    cv2.convertScaleAbs, it does not take an absolute value, which would lead to
    nonsensical results (e.g., a pixel at 44 with alpha = 3 and beta = -210
    becomes 78 with OpenCV, when in fact it should become 0).
    """

    new_img = img * alpha + beta
    new_img[new_img < 0] = 0
    new_img[new_img > 255] = 255
    return new_img.astype(np.uint8)

# Automatic brightness and contrast optimization with optional histogram clipping
def automatic_brightness_and_contrast(image, clip_hist_percent=25):
    gray = cv2.cvtColor(image, cv2.COLOR_BGR2GRAY)

    # Calculate grayscale histogram
    hist = cv2.calcHist([gray],[0],None,[256],[0,256])
    hist_size = len(hist)

    # Calculate cumulative distribution from the histogram
    accumulator = []
    accumulator.append(float(hist[0]))
    for index in range(1, hist_size):
        accumulator.append(accumulator[index -1] + float(hist[index]))

    # Locate points to clip
    maximum = accumulator[-1]
    clip_hist_percent *= (maximum/100.0)
    clip_hist_percent /= 2.0

    # Locate left cut
    minimum_gray = 0
    while accumulator[minimum_gray] < clip_hist_percent:
        minimum_gray += 1

    # Locate right cut
    maximum_gray = hist_size -1
    while accumulator[maximum_gray] >= (maximum - clip_hist_percent):
        maximum_gray -= 1

    # Calculate alpha and beta values
    alpha = 255 / (maximum_gray - minimum_gray)
    beta = -minimum_gray * alpha

    '''
    # Calculate new histogram with desired range and show histogram 
    new_hist = cv2.calcHist([gray],[0],None,[256],[minimum_gray,maximum_gray])
    plt.plot(hist)
    plt.plot(new_hist)
    plt.xlim([0,256])
    plt.show()
    '''

    auto_result = convertScale(image, alpha=alpha, beta=beta)
    return (auto_result, alpha, beta)

image = cv2.imread('1.jpg')
auto_result, alpha, beta = automatic_brightness_and_contrast(image)
print('alpha', alpha)
print('beta', beta)
cv2.imshow('auto_result', auto_result)
cv2.imwrite('auto_result.png', auto_result)
cv2.imshow('image', image)
cv2.waitKey()

1
当前的直方图剪裁技术可以去除大部分离群值,通常适用于增加对比度/亮度,但由于您试图获取完全白色背景图像,因此很难确定自动alpha/beta。通常使用平均值,但要获得完全白色背景,您需要一些指示器来偏移值相对于平均值。也许添加一个常数可以起作用。无论如何,这是一个有趣的问题。祝你好运! - nathancy
@nathancy,谢谢你给我展示这个,但是为什么在彩色图像中使用min_gray和max_gray呢?我是否需要将其转换为灰度图像以查找这些值,还是分别对RGB进行操作,最终得到3个不同的alpha和beta值? - mLstudent33
@nathancy,我看到分布向更高的像素值转移,但我不确定有趣的部分是否是这样找到的。梯度和来自缝合削减的想法如何?例如,黑色背景上有一个微小的白点。 - mLstudent33
1
@mLstudent33,这是一个很好的问题。我从未尝试过在能量地图上使用它。我相信它是基于图像中所有像素的相对阈值来增强的,所以我的猜测是它仍然应该可以工作,但效果不会那么明显。 - nathancy
1
@nathancy,alpha和beta计算背后的数学概念是什么?有没有论文或其他资料可以参考,以更好地理解这一步骤? - hux0
显示剩余6条评论

51

强健的本地自适应软二值化!我就是这么称呼它。

我之前做过类似的事情,但目的有些不同,所以可能并不完全适合您的需求,但希望能有所帮助(此外,我是在晚上为个人使用而编写这段代码的,因此代码很丑陋)。从某种意义上说,这段代码旨在解决比您的更一般的情况,即背景上可能有很多结构化噪声(请参见下面的演示)。

这段代码是干什么用的? 给定一张纸张的照片,它将会把它变白,使其可以完美打印。请参见下面的示例图像。

预告: 这个算法处理后,您的页面将会看起来像这样(处理前和处理后)。请注意,即使彩色标记注释也被去除了,因此我不知道这是否适合您的用例,但这段代码可能会有用:

为了获得{{完美干净}}的结果,您可能需要稍微调整一下过滤参数,但是正如您所看到的,即使使用默认参数,它也可以很好地工作。

步骤0:将图像裁剪以紧密适合页面

假设您已经完成了这一步骤(根据您提供的示例,似乎是这样)。如果您需要手动注释和重编工具,请私信我!^^ 这一步骤的结果如下(我在这里使用的示例可能比您提供的更难,虽然它可能不完全符合您的情况):

从这里我们可以立即看到以下问题:

  • 光线条件不均匀。 这意味着所有简单的二值化方法都不起作用。我尝试了很多在OpenCV中可用的解决方案,以及它们的组合,但都没有效果!
  • 很多背景噪音。 在我的情况下,我需要去除纸张上的网格,以及透过薄纸张看到的另一面的墨水。

步骤1:伽马校正

这一步的目的是平衡整个图像的对比度(因为您的图像可能会因光照条件略微过曝/欠曝)。

这一步乍看起来可能是一个不必要的步骤,但它的重要性不容低估:从某种意义上讲,它将图像归一化到类似的曝光分布中,以便您稍后可以选择有意义的超参数(例如下一节中的DELTA参数、噪声过滤参数、形态学参数等)。

# Somehow I found the value of `gamma=1.2` to be the best in my case
def adjust_gamma(image, gamma=1.2):
    # build a lookup table mapping the pixel values [0, 255] to
    # their adjusted gamma values
    invGamma = 1.0 / gamma
    table = np.array([((i / 255.0) ** invGamma) * 255
        for i in np.arange(0, 256)]).astype("uint8")

    # apply gamma correction using the lookup table
    return cv2.LUT(image, table)

这里是伽马调整的结果:

现在你可以看到它更加“平衡”了。如果没有这一步骤,所有你后面手动选择的参数都会变得不够稳健!


第二步:自适应二值化以检测文本块

在这一步中,我们将自适应地对文本块进行二值化处理。我稍后会添加更多注释,但基本思路如下:

  • 我们将图像分成大小为BLOCK_SIZE。关键是选择足够大的块大小,以便仍然可以获得大量的文本和背景(即大于任何符号),但又足够小,不会受到任何光照条件变化的影响(即“大,但仍然局部”)。
  • 在每个块内,我们进行局部自适应二值化:我们查看中位数并假设它是背景(因为我们选择了足够大的BLOCK_SIZE,使大多数块都是背景)。然后,我们进一步定义DELTA——基本上只是一个“离中位数多远仍然考虑它是背景?”的阈值。

所以,函数process_image完成了任务。此外,您可以修改preprocesspostprocess函数以适应您的需求(但是,正如您从上面的示例中看到的那样,该算法非常鲁棒,即它在不太修改参数的情况下就可以很好地工作)。

此部分的代码假设前景比背景暗(即墨水在纸上)。但是,您可以通过调整preprocess函数来轻松更改它:而不是返回255-image,只需返回image

# These are probably the only important parameters in the
# whole pipeline (steps 0 through 3).
BLOCK_SIZE = 40
DELTA = 25

# Do the necessary noise cleaning and other stuffs.
# I just do a simple blurring here but you can optionally
# add more stuffs.
def preprocess(image):
    image = cv2.medianBlur(image, 3)
    return 255 - image

# Again, this step is fully optional and you can even keep
# the body empty. I just did some opening. The algorithm is
# pretty robust, so this stuff won't affect much.
def postprocess(image):
    kernel = np.ones((3,3), np.uint8)
    image = cv2.morphologyEx(image, cv2.MORPH_OPEN, kernel)
    return image

# Just a helper function that generates box coordinates
def get_block_index(image_shape, yx, block_size): 
    y = np.arange(max(0, yx[0]-block_size), min(image_shape[0], yx[0]+block_size))
    x = np.arange(max(0, yx[1]-block_size), min(image_shape[1], yx[1]+block_size))
    return np.meshgrid(y, x)

# Here is where the trick begins. We perform binarization from the 
# median value locally (the img_in is actually a slice of the image). 
# Here, following assumptions are held:
#   1.  The majority of pixels in the slice is background
#   2.  The median value of the intensity histogram probably
#       belongs to the background. We allow a soft margin DELTA
#       to account for any irregularities.
#   3.  We need to keep everything other than the background.
#
# We also do simple morphological operations here. It was just
# something that I empirically found to be "useful", but I assume
# this is pretty robust across different datasets.
def adaptive_median_threshold(img_in):
    med = np.median(img_in)
    img_out = np.zeros_like(img_in)
    img_out[img_in - med < DELTA] = 255
    kernel = np.ones((3,3),np.uint8)
    img_out = 255 - cv2.dilate(255 - img_out,kernel,iterations = 2)
    return img_out

# This function just divides the image into local regions (blocks),
# and perform the `adaptive_mean_threshold(...)` function to each
# of the regions.
def block_image_process(image, block_size):
    out_image = np.zeros_like(image)
    for row in range(0, image.shape[0], block_size):
        for col in range(0, image.shape[1], block_size):
            idx = (row, col)
            block_idx = get_block_index(image.shape, idx, block_size)
            out_image[block_idx] = adaptive_median_threshold(image[block_idx])
    return out_image

# This function invokes the whole pipeline of Step 2.
def process_image(img):
    image_in = cv2.cvtColor(img, cv2.COLOR_BGR2GRAY)
    image_in = preprocess(image_in)
    image_out = block_image_process(image_in, BLOCK_SIZE)
    image_out = postprocess(image_out)
    return image_out

结果是漂亮的斑点,紧密地跟随着墨迹:


步骤三:二值化的“软”部分

有了覆盖符号和一点点额外区域的斑块,我们最终可以进行漂白过程。

如果我们更仔细地观察带有文本的纸张照片(特别是那些有手写的),从“背景”(白纸)到“前景”(黑色墨水)的转换不是很明显,而是非常渐进的。本节中其他基于二值化的答案提出了一个简单的阈值处理方法(即使它们是局部自适应的,仍然是一个阈值),对于印刷文字效果还不错,但对于手写文字则会产生不太美观的结果。

因此,本节的动机是我们想保留从黑到白的渐进传输效果,就像自然墨水的纸张照片一样。最终目的是使其可打印。

主要思路很简单:像素值(经过上述阈值处理后)与局部最小值之间的差异越大,它属于背景的可能性就越大。我们可以使用一组Sigmoid函数来表达这一点,重新缩放到局部块的范围内(以便该函数在整个图像中自适应缩放)。

# This is the function used for composing
def sigmoid(x, orig, rad):
    k = np.exp((x - orig) * 5 / rad)
    return k / (k + 1.)

# Here, we combine the local blocks. A bit lengthy, so please
# follow the local comments.
def combine_block(img_in, mask):
    # First, we pre-fill the masked region of img_out to white
    # (i.e. background). The mask is retrieved from previous section.
    img_out = np.zeros_like(img_in)
    img_out[mask == 255] = 255
    fimg_in = img_in.astype(np.float32)

    # Then, we store the foreground (letters written with ink)
    # in the `idx` array. If there are none (i.e. just background),
    # we move on to the next block.
    idx = np.where(mask == 0)
    if idx[0].shape[0] == 0:
        img_out[idx] = img_in[idx]
        return img_out

    # We find the intensity range of our pixels in this local part
    # and clip the image block to that range, locally.
    lo = fimg_in[idx].min()
    hi = fimg_in[idx].max()
    v = fimg_in[idx] - lo
    r = hi - lo

    # Now we use good old OTSU binarization to get a rough estimation
    # of foreground and background regions.
    img_in_idx = img_in[idx]
    ret3,th3 = cv2.threshold(img_in[idx],0,255,cv2.THRESH_BINARY+cv2.THRESH_OTSU)

    # Then we normalize the stuffs and apply sigmoid to gradually
    # combine the stuffs.
    bound_value = np.min(img_in_idx[th3[:, 0] == 255])
    bound_value = (bound_value - lo) / (r + 1e-5)
    f = (v / (r + 1e-5))
    f = sigmoid(f, bound_value + 0.05, 0.2)

    # Finally, we re-normalize the result to the range [0..255]
    img_out[idx] = (255. * f).astype(np.uint8)
    return img_out

# We do the combination routine on local blocks, so that the scaling
# parameters of Sigmoid function can be adjusted to local setting
def combine_block_image_process(image, mask, block_size):
    out_image = np.zeros_like(image)
    for row in range(0, image.shape[0], block_size):
        for col in range(0, image.shape[1], block_size):
            idx = (row, col)
            block_idx = get_block_index(image.shape, idx, block_size)
            out_image[block_idx] = combine_block(
                image[block_idx], mask[block_idx])
    return out_image

# Postprocessing (should be robust even without it, but I recommend
# you to play around a bit and find what works best for your data.
# I just left it blank.
def combine_postprocess(image):
    return image

# The main function of this section. Executes the whole pipeline.
def combine_process(img, mask):
    image_in = cv2.cvtColor(img, cv2.COLOR_BGR2GRAY)
    image_out = combine_block_image_process(image_in, mask, 20)
    image_out = combine_postprocess(image_out)
    return image_out

由于这些都是可选项,因此有些内容被注释掉了。 combine_process 函数从上一步骤获取掩码,并执行整个合成管道。您可以尝试根据自己的数据(图像)进行调整。结果非常好:

我可能会在这个答案的代码中添加更多的注释和解释。将整个代码(包括裁剪和变形代码)上传到Github。


1
感谢您分享这个伟大的方法!然而,它是二值化的,因此输出不会保留颜色渐变(例如:假设扫描纸张上有一张照片!),所以它并不完全符合本主题的要求。但再次感谢您分享这个有趣的方法! - Basj
1
或者@FalconUA,您是否有修改过的算法版本,仍然保留颜色(但只是找到最佳亮度/对比度平衡,详见我的问题)? - Basj
将处理后的图片和原始图片叠放在一起,并在像素为黑色的位置恢复颜色。 - Ashot Matevosyan
@hav4ik,你上传了这段代码吗? - Demetry Pascal
我认为在使用meshgrid对数组进行索引的部分,在当前的opencv/numpy版本中,必须在某些地方将其拆分为两个变量,以使此代码正常工作。 - Manimaran Paneerselvam
显示剩余3条评论

25

enter image description here

这种方法对于你的应用来说应该很有效。首先,找到一个在强度直方图中清晰地分离分布模式的阈值,然后使用该值重新缩放强度。

from skimage.filters import threshold_yen
from skimage.exposure import rescale_intensity
from skimage.io import imread, imsave

img = imread('mY7ep.jpg')

yen_threshold = threshold_yen(img)
bright = rescale_intensity(img, (0, yen_threshold), (0, 255))

imsave('out.jpg', bright)

我在这里使用Yen的方法,可以在此页面了解更多关于此方法的信息。


3
有趣,谢谢分享!当图像的光照条件差异很大时,这种方法是否有效? - Chan Kha Vu
@FalconUA 我猜它不是这样工作的。我已经在我的RGB图像中测试过了,结果是一个空白的文档图像。原因是亮度调整比率不是针对区域的,而是threshold_yen计算准确到整个图像。你找到了可行的解决方案吗? - Muneeb Ahmad Khurram

20
我认为实现这个的方法是:1)从HCL颜色空间中提取色度(饱和度)通道。(HCL比HSL或HSV更好)。只有颜色应该具有非零饱和度,因此亮色和灰色阴影将变暗。2)使用大津阈值处理阈值结果以用作掩码。3)将输入转换为灰度并应用局部区域(即自适应)阈值。4)将掩码放入原始图像的alpha通道中,然后将局部区域阈值结果与原始图像合成,以便保留原始图像的彩色区域,并在其他地方使用局部区域阈值结果。
抱歉,我不太了解OpeCV,但以下是使用ImageMagick的步骤。
请注意,通道从0开始编号。(H=0或红色,C=1或绿色,L=2或蓝色)
输入:

enter image description here

magick image.jpg -colorspace HCL -channel 1 -separate +channel tmp1.png


enter image description here

magick tmp1.png -auto-threshold otsu tmp2.png


enter image description here

magick image.jpg -colorspace gray -negate -lat 20x20+10% -negate tmp3.png


enter image description here

magick tmp3.png \( image.jpg tmp2.png -alpha off -compose copy_opacity -composite \) -compose over -composite result.png


enter image description here

补充:

这是Python Wand代码,可以产生相同的输出结果。它需要Imagemagick 7和Wand 0.5.5。

#!/bin/python3.7

from wand.image import Image
from wand.display import display
from wand.version import QUANTUM_RANGE

with Image(filename='text.jpg') as img:
    with img.clone() as copied:
        with img.clone() as hcl:
            hcl.transform_colorspace('hcl')
            with hcl.channel_images['green'] as mask:
                mask.auto_threshold(method='otsu')
                copied.composite(mask, left=0, top=0, operator='copy_alpha')
                img.transform_colorspace('gray')
                img.negate()
                img.adaptive_threshold(width=20, height=20, offset=0.1*QUANTUM_RANGE)
                img.negate()
                img.composite(copied, left=0, top=0, operator='over')
                img.save(filename='text_process.jpg')

哇,这是一个相当不错的解决方案。我希望我早些知道这些技巧,这样我就不必从OpenCV的样板中自己实现类似的东西了。 - Chan Kha Vu
1
由于Python Wand基于Imagemagick,因此也可以使用它来完成这个任务。 - fmw42
2
我已经在“ADDITION”中添加了Python Wand代码。 - fmw42
最佳解决方案,因为它可以进行正确的转换,不需要Python编程技能。 - Ivan Z

12

首先,我们将文本和颜色标记分开。可以在带有颜色饱和度通道的颜色空间中完成此操作。我使用了一种非常简单的方法,受到这篇论文的启发:min(R,G,B)/max(R,G,B)的比率将接近于1(浅)灰色区域,并且小于1的值表示彩色区域。对于深灰色区域,我们得到0到1之间的任何值,但这并不重要:这些区域要么进入颜色掩码并按原样添加,要么不包括在掩码中并被贡献给二值化文本的输出。对于黑色,我们利用了当转换为uint8时0/0变为0的事实。

灰度图像文本被局部二值化处理生成黑白图像。你可以从这个比较那个调查中选择你喜欢的技术。我选择了NICK技术,它能很好地处理低对比度情况,并且相当健壮,即在参数k约为-0.3至-0.1之间的选择适用于非常广泛的条件,这对于自动处理是很好的。对于提供的样本文档,所选择的技术并不起到很大的作用,因为它的照明相对均匀,但为了处理非均匀照明的图像,应该使用局部二值化技术。
在最后一步中,彩色区域被添加回二值化的文本图像中。
因此,这个解决方案与@fmw42的解决方案非常相似(所有思路都归功于他),唯一不同的是颜色检测和二值化方法。
image = cv2.imread('mY7ep.jpg')

# make mask and inverted mask for colored areas
b,g,r = cv2.split(cv2.blur(image,(5,5)))
np.seterr(divide='ignore', invalid='ignore') # 0/0 --> 0
m = (np.fmin(np.fmin(b, g), r) / np.fmax(np.fmax(b, g), r)) * 255
_,mask_inv = cv2.threshold(np.uint8(m), 0, 255, cv2.THRESH_BINARY+cv2.THRESH_OTSU)
mask = cv2.bitwise_not(mask_inv)

# local thresholding of grayscale image
gray = cv2.cvtColor(image, cv2.COLOR_BGR2GRAY)
text = cv2.ximgproc.niBlackThreshold(gray, 255, cv2.THRESH_BINARY, 41, -0.1, binarizationMethod=cv2.ximgproc.BINARIZATION_NICK)

# create background (text) and foreground (color markings)
bg = cv2.bitwise_and(text, text, mask = mask_inv)
fg = cv2.bitwise_and(image, image, mask = mask)

out = cv2.add(cv2.cvtColor(bg, cv2.COLOR_GRAY2BGR), fg) 

enter image description here

如果不需要彩色标记,您可以直接对灰度图像进行二值化处理:
image = cv2.imread('mY7ep.jpg')
gray = cv2.cvtColor(image, cv2.COLOR_BGR2GRAY)
text = cv2.ximgproc.niBlackThreshold(gray, 255, cv2.THRESH_BINARY, at_bs, -0.3, binarizationMethod=cv2.ximgproc.BINARIZATION_NICK)

enter image description here


在后面的例子中,参数 at_bs 的值是多少? - n0099
@n0099 抱歉,我忘记在示例中包含它了。我现在没有电脑访问权限,所以无法检查 - 稍后会回复。与此同时,您可以尝试任何奇数5或7等。 - Stef

0
这是一个 C# 转换(通过 https://github.com/uxmal/pytocs 执行),用于 nathancy 的答案,针对 Emgu.CV 封装库:
/// <summary>
/// <see>https://dev59.com/SlMI5IYBdhLWcg3wJ4Kz#75455163
/// </summary>
public static (Mat autoResult, int alpha, int beta) AutomaticBrightnessAndContrast(Mat image, double clipHistPercent = 1)
{
    var gray = new Mat();
    CvInvoke.CvtColor(image, gray, ColorConversion.Bgr2Gray);
    // Calculate grayscale histogram
    var hist = new Mat();
    var grayVector = new VectorOfMat(gray);
    CvInvoke.CalcHist(grayVector, new[] {0}, null, hist, new[] {256}, new[] {0f, 256}, false);
    var histSize = hist.Rows;
    // Calculate cumulative distribution from the histogram
    var accumulator = new List<float> {hist.Get<float>(0, 0)};
    foreach (var index in Enumerable.Range(1, histSize - 1))
        accumulator.Add(accumulator[index - 1] + hist.Get<float>(index, 0));

    // Locate points to clip
    var maximum = accumulator[255];
    clipHistPercent *= maximum / 100.0;
    clipHistPercent /= 2.0;
    // Locate left cut
    var minimumGray = 0;
    while (accumulator[minimumGray] < clipHistPercent)
        minimumGray += 1;

    // Locate right cut
    var maximumGray = histSize - 1;
    while (accumulator[maximumGray] >= maximum - clipHistPercent)
        maximumGray -= 1;

    // Calculate alpha and beta values
    var alpha = 255 / (maximumGray - minimumGray);
    var beta = -minimumGray * alpha;
    var autoResult = new Mat();
    CvInvoke.ConvertScaleAbs(image, autoResult, alpha, beta);
    return (autoResult, alpha, beta);
}

public static class MatExtension
{
    /// <summary>
    /// <see>https://dev59.com/ZVwY5IYBdhLWcg3wwqA5#69537504
    /// </summary>
    public static unsafe T Get<T>(this Mat mat, int row, int col) =>
        new ReadOnlySpan<T>(mat.DataPointer.ToPointer(), mat.Rows * mat.Cols * mat.ElementSize)
            [(row * mat.Cols) + col];
}

如果您正在使用 OpenCvSharp,只需修改所有对 OpenCV 的调用,并使用更新的参数,例如在 C++ 中旋转图像而不裁剪 OpenCV

另外请注意,OpenCvSharp已经有了类似于原始OpenCV中的mat.at<>方法的Mat.Set<>方法,因此我们不必从How can I get and set pixel values of an EmguCV Mat image?复制这些方法。

网页内容由stack overflow 提供, 点击上面的
可以查看英文原文,
原文链接