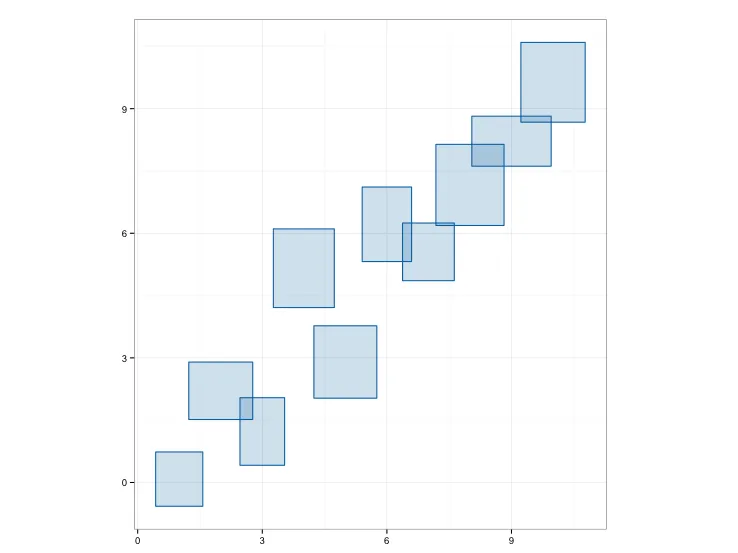
我正在绘制一个4维数据集。除了x轴和y轴之外,我想通过不同宽度和高度的矩形来表示第三维和第四维。我能用
ggplot做到吗?谢谢。ggplot做到吗?谢谢。以下是一个示例:
dd <- data.frame(x = (x <- 1:10),
                 y = x + rnorm(10), width = runif(10,1,2), height = runif(10,1,2))

ggplot(data = dd) +
  geom_rect(aes(xmax = x + width/2, xmin = x - width/2,
                ymax = y + height/2, ymin = y - height/2),
            alpha =0.2, color = rgb(0,114,178, maxColorValue=256),
            fill = rgb(0,114,178, maxColorValue=256)) +
  coord_fixed() +
  theme_bw()
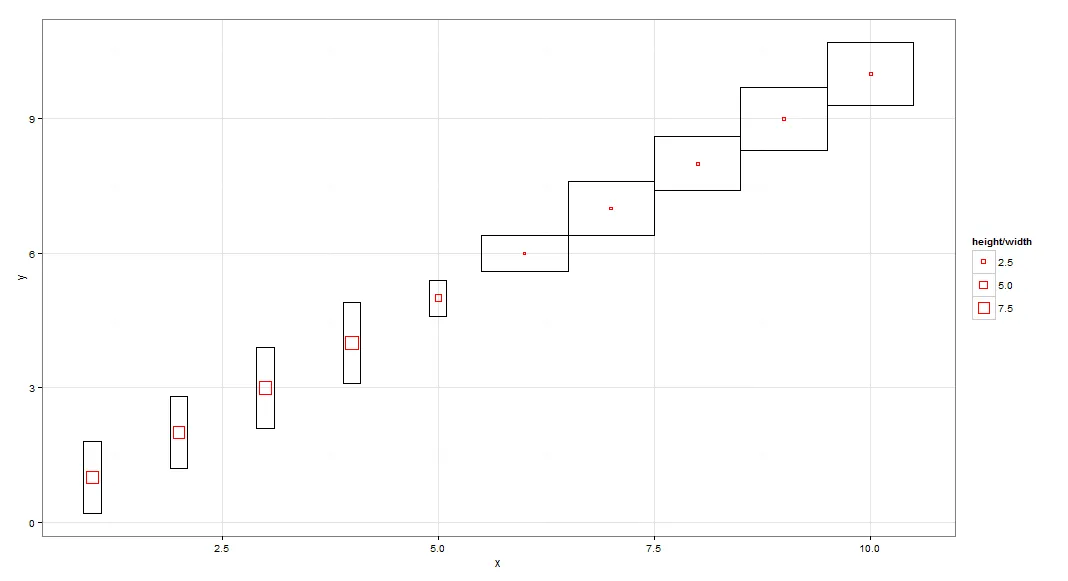
geom_point模拟矩形geom_rect创建以点为中心的矩形d=data.frame(x=seq(1,10),
y=seq(1,10),
width=rep(c(0.1,0.5),each =5),
height=rep(c(0.8,0.9,0.4,0.6,0.7),each =2))
ggplot(data = d) +
geom_rect(aes(xmax = x + width, xmin = x-width,
ymax = y+height, ymin = y - height),
color = "black", fill = NA) +
geom_point(mapping=aes(x=x, y=y,size=height/width),
color='red',shape=0)+
theme_bw()