我希望能根据字符串中的位置突出显示文本,例如如果我们有以下文本:
this is a really nice informative piece of text
我想说让我们在位置2到4周围画一个矩形:
t[his] is a really nice informative piece of text
我尝试在ggplot2中使用以下代码进行操作:
library(ggplot2)
library(dplyr)

box.data <- data.frame(
  start   = c(4,6,5,7,10,7),
  type    = c('BOX1.start', 'BOX1.start', 'BOX1.start','BOX1.end', 'BOX1.end', 'BOX1.end'),
  text.id = c(1,2,3,1,2,3)
)

text.data <- data.frame(
  x = rep(1,3),
  text.id = c(1,2,3),
  text = c('Thisissomerandomrandomrandomrandomtext1',
           'Thisissomerandomrandomrandomrandomtext2',
           'Thisissomerandomrandomrandomrandomtext3')
)


ggplot(data = text.data, aes(x = x, y = text.id)) +
  scale_x_continuous(limits = c(1, nchar(as.character(text.data$text[1])))) +
  geom_text(label = text.data$text, hjust = 0, size = 3) +
  geom_line(data = box.data, aes(x = start, y = text.id, group = text.id, size = 3, alpha = 0.5, colour = 'red'))
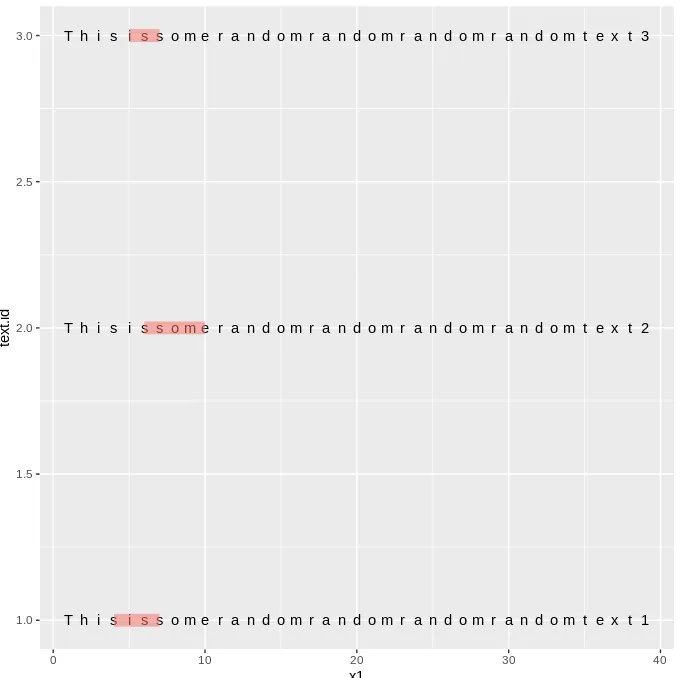
这会生成以下图表:
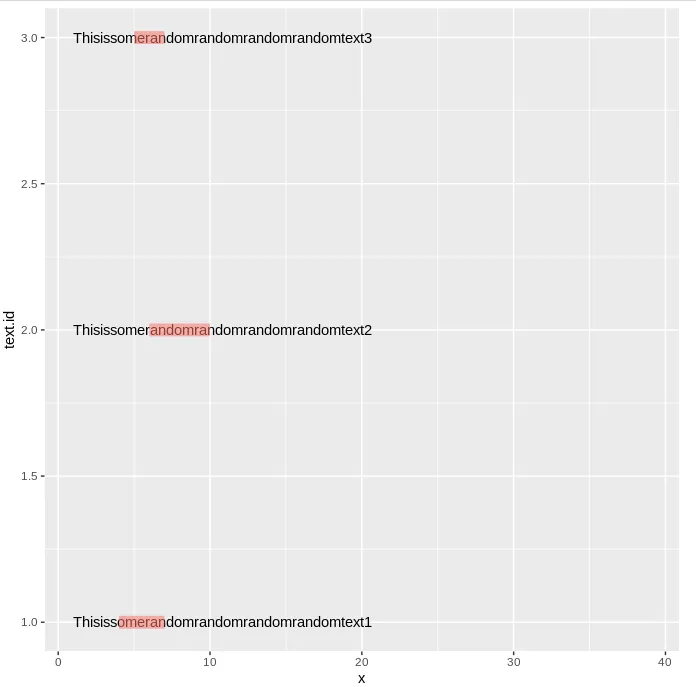 我的方法失败了,因为一个字母不能刚好覆盖x轴上的一个单位,有什么方法可以解决这个问题吗?