我创建了一个展示某个物种种群数量的 ggplot,这个脚本运行正常。因此我使用 for 循环生成 25 种物种的图表,但它无法正常运行。
以下是一个物种的示例:
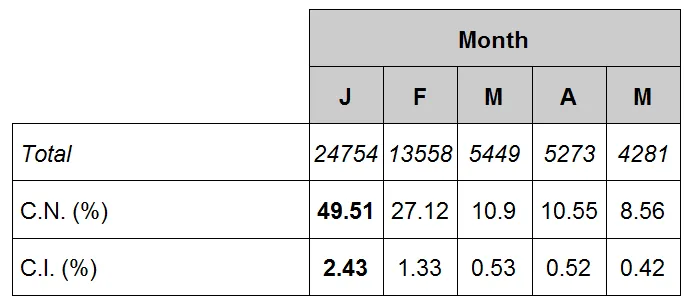
以下是一个物种的示例:
A <- data.frame(sp="A",x=c(rep(0.1,3),rep(2,3),rep(4.5:8.5,4),6.5), width=c(rep(NA,3), rep(4,3), rep(1,20),5),y=c(rep(1:3,2), rep(1:4, each=5),5),col=c(rep("white",21), rep("grey80",6)), name1=c("C.I. (%)","C.N. (%)", rep("",25)), name1i=c(rep("",2), "Total",rep("",24)), nb1=c(rep(NA,7),1.33,0.53,0.52,0.42,NA,27.12,10.90,10.55,8.56,rep(NA,11)),nb2=c(rep(NA,16),24754,13558,5449,5273,4281,rep(NA,6)),nb3=c(rep(NA,6),2.43,rep(NA,4),49.51, rep(NA,15)), name2=c(rep("",21),"J","F","M","A","M","Month"))

library(ggplot2)
library(gridExtra)
  table <- A
  windows()
  ggplot(table, aes(x=x, y=y, width=width, fill=col))+
    geom_tile(colour="black")+
    scale_fill_manual(values = c("white"="white", "grey80"="grey80"),
                      breaks = levels(table$col), na.value = "white")+
    geom_text(aes(label=name1), size=6, hjust=0)+
    geom_text(aes(label=name1i), size=6, hjust=0, fontface=3)+
    geom_text(aes(label=nb1), size=6)+
    geom_text(aes(label=nb2), size=6, fontface=3)+
    geom_text(aes(label=nb3), size=6, fontface="bold")+
    geom_text(aes(label=name2), size=6, fontface="bold")+
    coord_cartesian(xlim=c(0,9), ylim=c(0.5,5.5))+
    labs(x = "",y = "") +
    scale_x_discrete(expand = c(0, 0)) +
    scale_y_discrete(expand = c(0, 0))+
    theme(axis.ticks = element_blank(),
          axis.text = element_blank(),
          legend.position = "none",
          panel.background = element_rect(fill='white', colour='white'),
          plot.margin = unit(c(0.5,0.5,-1,-1), "lines"))
对于使用for循环的两种不同种类:
A <- data.frame(sp="A",x=c(rep(0.1,3),rep(2,3),rep(4.5:8.5,4),6.5), width=c(rep(NA,3), rep(4,3), rep(1,20),5),y=c(rep(1:3,2), rep(1:4, each=5),5),col=c(rep("white",21), rep("grey80",6)), name1=c("C.I. (%)","C.N. (%)", rep("",25)), name1i=c(rep("",2), "Total",rep("",24)), nb1=c(rep(NA,7),1.33,0.53,0.52,0.42,NA,27.12,10.90,10.55,8.56,rep(NA,11)),nb2=c(rep(NA,16),24754,13558,5449,5273,4281,rep(NA,6)),nb3=c(rep(NA,6),2.43,rep(NA,4),49.51, rep(NA,15)), name2=c(rep("",21),"J","F","M","A","M","Month"))
B <- data.frame(sp="B",x=c(rep(0.1,3),rep(2,3),rep(4.5:8.5,4),6.5), width=c(rep(NA,3), rep(4,3), rep(1,20),5),y=c(rep(1:3,2), rep(1:4, each=5),5),col=c(rep("white",21), rep("grey80",6)), name1=c("C.I. (%)","C.N. (%)", rep("",25)), name1i=c(rep("",2), "Total",rep("",24)), nb1=c(rep(NA,6),4.5,6.74,3.43,3.56,NA,19.89,29.82,15.18,15.75,rep(NA,12)),nb2=c(rep(NA,16),3282,4920,2504,2599,5328,rep(NA,6)),nb3=c(rep(NA,10),7.30,rep(NA,4),32.29, rep(NA,11)), name2=c(rep("",21),"J","F","M","A","M","Month"))
data <- rbind(A,B)
sp <- c("A","B")

library(ggplot2)
library(gridExtra)
for(i in sp){
  table <- data[data$sp==i,]
  windows()
  ggplot(table, aes(x=x, y=y, width=width, fill=col))+
    geom_tile(colour="black")+
    scale_fill_manual(values = c("white"="white", "grey80"="grey80"),
                      breaks = levels(table$col), na.value = "white")+
    geom_text(aes(label=name1), size=6, hjust=0)+
    geom_text(aes(label=name1i), size=6, hjust=0, fontface=3)+
    geom_text(aes(label=nb1), size=6)+
    geom_text(aes(label=nb2), size=6, fontface=3)+
    geom_text(aes(label=nb3), size=6, fontface="bold")+
    geom_text(aes(label=name2), size=6, fontface="bold")+
    coord_cartesian(xlim=c(0,9), ylim=c(0.5,5.5))+
    labs(x = "",y = "") +
    scale_x_discrete(expand = c(0, 0)) +
    scale_y_discrete(expand = c(0, 0))+
    theme(axis.ticks = element_blank(),
          axis.text = element_blank(),
          legend.position = "none",
          panel.background = element_rect(fill='white', colour='white'),
          plot.margin = unit(c(0.5,0.5,-1,-1), "lines"))
}
没有错误信息的情况下,图表为空,所以我不明白我的错误在哪里。这可能仅仅是一个ggplot问题吗?实际上,我不认为是这样的,因为其他的ggplot循环工作得很好......您有任何想法吗?感谢您的帮助!
pl = plyr::dlply(data, "sp", "%+%", e1=last_plot()); do.call(grid.arrange, pl)- baptiste