我想要增加我正在处理的图表的X轴上显示的值,方式如下:
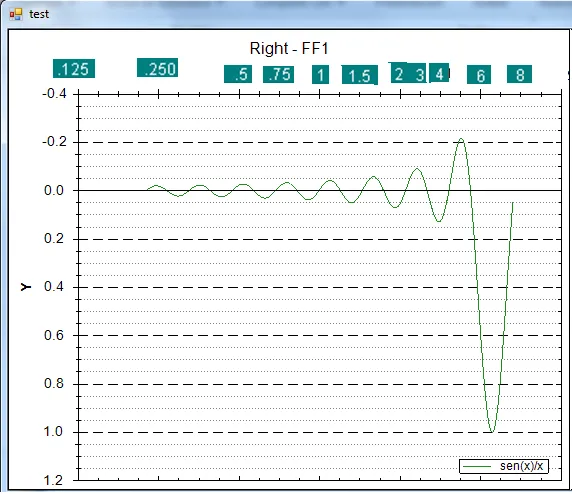
X轴从0.125开始,然后显示0.250、0.5、1.0,然后数字为1.5、2、3、4、5、6、8、12,如下图所示(当然,这个图是不正确的,但我想展示X轴值的缩放)
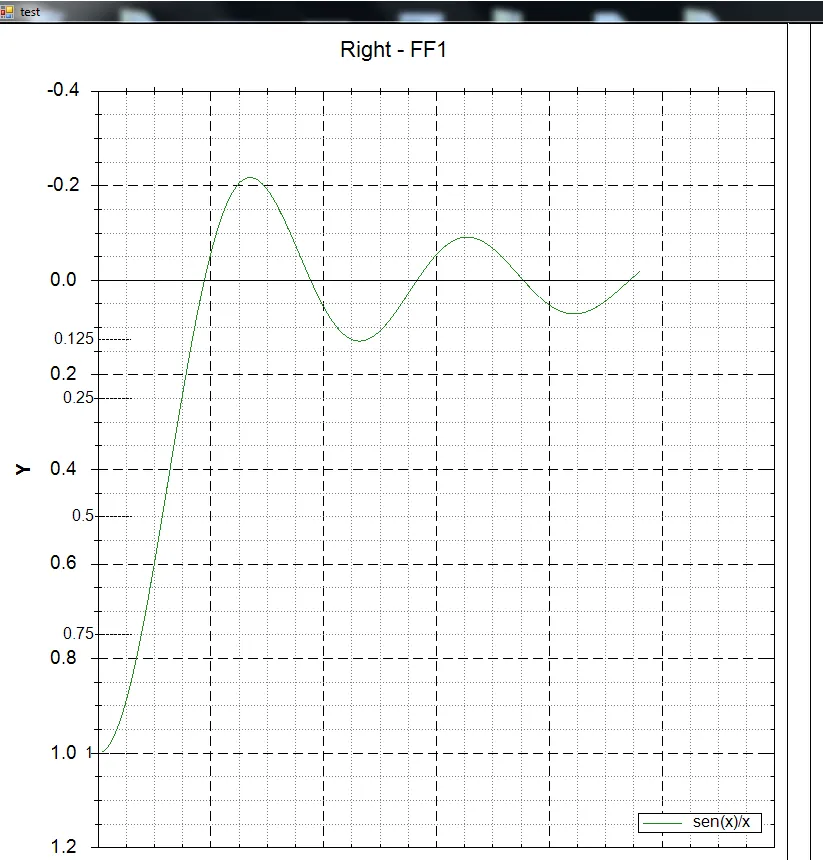
目前我有这个:
为了做到这一点,我使用了以下代码(vb.net版本):
Imports System.Collections.Generic
Imports System.ComponentModel
Imports System.Data
Imports System.Drawing
Imports System.Text
Imports System.Windows.Forms
Imports ZedGraph

Namespace Grid
    Partial Public Class graficaControl
        Inherits Form
        Public Sub New()
            InitializeComponent()
            DrawGraph()
        End Sub


        Private Function h(ByVal x As Double) As Double
            If x = 0 Then
                Return 1
            End If

            Return Math.Sin(x) / x
        End Function

        Private Function f(ByVal x As Double) As Double
            If x = 0 Then
                Return 1
            End If

            Return Math.Sin(x)
        End Function

        Private Function g(ByVal x As Double) As Double
            If x = 1 Then
                Return 0
            End If

            Return Math.Cos(x)
        End Function


        Private Sub DrawGraph()
            Dim masterPane As ZedGraph.MasterPane = zedGraph.MasterPane
            Dim pane As New GraphPane()
            masterPane.PaneList.Clear()

            pane.XAxis.Title.Text = "X"
            pane.XAxis.Title.FontSpec.IsUnderline = False
            pane.XAxis.Title.FontSpec.IsBold = True
            pane.XAxis.Title.FontSpec.FontColor = Color.Blue
            pane.YAxis.Title.Text = "Y"
            pane.Title.Text = "Right - FF1"
            pane.Title.FontSpec.Fill.IsVisible = True
            pane.Title.FontSpec.IsBold = False

            'X AXIS UP
            pane.X2Axis.IsVisible = True
            pane.XAxis.IsVisible = False
            pane.YAxis.Scale.IsReverse = True

            'Grid
            pane.XAxis.MajorGrid.IsVisible = True
            pane.XAxis.MajorGrid.DashOn = 10
            pane.XAxis.MajorGrid.DashOff = 5
            pane.YAxis.MajorGrid.IsVisible = True
            pane.YAxis.MajorGrid.DashOn = 10
            pane.YAxis.MajorGrid.DashOff = 5
            pane.YAxis.MinorGrid.IsVisible = True
            pane.YAxis.MinorGrid.DashOn = 1
            pane.YAxis.MinorGrid.DashOff = 2
            pane.XAxis.MinorGrid.IsVisible = True
            pane.XAxis.MinorGrid.DashOn = 1
            pane.XAxis.MinorGrid.DashOff = 2


            'FOR TEXT
            pane.Legend.Position = LegendPos.Float
            pane.Legend.Location.CoordinateFrame = CoordType.ChartFraction
            pane.Legend.Location.AlignH = AlignH.Right
            pane.Legend.Location.AlignV = AlignV.Bottom
            pane.Legend.Location.TopLeft = New PointF(1.0F - 0.02F, 1.0F - 0.02F)


            iGraph(pane)

            ' Add to master
            masterPane.Add(pane)

            'later add second graph
            Using g As Graphics = CreateGraphics()
                masterPane.SetLayout(g, PaneLayout.SquareColPreferred)
           End Using

            zedGraph.AxisChange()
            zedGraph.Invalidate()
        End Sub

        Private Sub iGraph(ByVal izq As GraphPane)
            izq.CurveList.Clear()
            Dim list As New PointPairList()
            Dim xmin As Double = -50
            Dim xmax As Double = 3
            Dim x As Double = xmin
            While x <= xmax
                list.Add(x, h(x))
                x += 0.01
            End While
            Dim myCurve As LineItem = izq.AddCurve("sen(x)/x", list, Color.ForestGreen, SymbolType.None)
        End Sub
        Private WithEvents zedGraph As ZedGraph.ZedGraphControl

        Private Sub InitializeComponent()
        Me.zedGraph = New ZedGraph.ZedGraphControl()
        Me.SuspendLayout()
        '
        'zedGraph
        '
        Me.zedGraph.Dock = System.Windows.Forms.DockStyle.Fill
        Me.zedGraph.Location = New System.Drawing.Point(0, 0)
        Me.zedGraph.Name = "Name"
        Me.zedGraph.ScrollGrace = 0.0R
        Me.zedGraph.ScrollMaxX = 0.0R
        Me.zedGraph.ScrollMaxY = 0.0R
        Me.zedGraph.ScrollMaxY2 = 0.0R
        Me.zedGraph.ScrollMinX = 0.0R
        Me.zedGraph.ScrollMinY = 0.0R
        Me.zedGraph.ScrollMinY2 = 0.0R
        Me.zedGraph.Size = New System.Drawing.Size(732, 461)
        Me.zedGraph.TabIndex = 1
        '
        'component
        '
        Me.AutoScaleDimensions = New System.Drawing.SizeF(6.0!, 13.0!)
        Me.AutoScaleMode = System.Windows.Forms.AutoScaleMode.Font
        Me.ClientSize = New System.Drawing.Size(732, 461)
        Me.Controls.Add(Me.zedGraph)
        Me.Name = "graph"
        Me.Text = "test"
        Me.ResumeLayout(False)

    End Sub
End Class
End Namespace
同时也有C#版本
using Microsoft.VisualBasic;
using System;
using System.Collections;
using System.Collections.Generic;
using System.Data;
using System.Diagnostics;
using System.ComponentModel;
using System.Drawing;
using System.Text;
using System.Windows.Forms;
using ZedGraph;

namespace Grid
{
    public partial class graficaControl : Form
    {
        public graficaControl()
        {
            InitializeComponent();
            DrawGraph();
        }


        private double h(double x)
        {
            if (x == 0) {
                return 1;
            }

            return Math.Sin(x) / x;
        }

        private double f(double x)
        {
            if (x == 0) {
                return 1;
            }

            return Math.Sin(x);
        }

        private double g(double x)
        {
            if (x == 1) {
                return 0;
            }

            return Math.Cos(x);
        }


        private void DrawGraph()
        {
            ZedGraph.MasterPane masterPane = zedGraph.MasterPane;
            GraphPane pane = new GraphPane();
            masterPane.PaneList.Clear();

            pane.XAxis.Title.Text = "X";
            pane.XAxis.Title.FontSpec.IsUnderline = false;
            pane.XAxis.Title.FontSpec.IsBold = true;
            pane.XAxis.Title.FontSpec.FontColor = Color.Blue;
            pane.YAxis.Title.Text = "Y";
            pane.Title.Text = "Right - FF1";
            pane.Title.FontSpec.Fill.IsVisible = true;
            pane.Title.FontSpec.IsBold = false;

            //X AXIS UP
            pane.X2Axis.IsVisible = true;
            pane.XAxis.IsVisible = false;
            pane.YAxis.Scale.IsReverse = true;

            //Grid
            pane.XAxis.MajorGrid.IsVisible = true;
            pane.XAxis.MajorGrid.DashOn = 10;
            pane.XAxis.MajorGrid.DashOff = 5;
            pane.YAxis.MajorGrid.IsVisible = true;
            pane.YAxis.MajorGrid.DashOn = 10;
            pane.YAxis.MajorGrid.DashOff = 5;
            pane.YAxis.MinorGrid.IsVisible = true;
            pane.YAxis.MinorGrid.DashOn = 1;
            pane.YAxis.MinorGrid.DashOff = 2;
            pane.XAxis.MinorGrid.IsVisible = true;
            pane.XAxis.MinorGrid.DashOn = 1;
            pane.XAxis.MinorGrid.DashOff = 2;


            //FOR TEXT
            pane.Legend.Position = LegendPos.Float;
            pane.Legend.Location.CoordinateFrame = CoordType.ChartFraction;
            pane.Legend.Location.AlignH = AlignH.Right;
            pane.Legend.Location.AlignV = AlignV.Bottom;
            pane.Legend.Location.TopLeft = new PointF(1f - 0.02f, 1f - 0.02f);


            iGraph(pane);

            // Add to master
            masterPane.Add(pane);

            //later add second graph
            using (Graphics g = CreateGraphics()) {
                masterPane.SetLayout(g, PaneLayout.SquareColPreferred);
            }

            zedGraph.AxisChange();
            zedGraph.Invalidate();
        }

        private void iGraph(GraphPane izq)
        {
            izq.CurveList.Clear();
            PointPairList list = new PointPairList();
            double xmin = -50;
            double xmax = 3;
            double x = xmin;
            while (x <= xmax) {
                list.Add(x, h(x));
                x += 0.01;
            }
            LineItem myCurve = izq.AddCurve("sen(x)/x", list, Color.ForestGreen, SymbolType.None);
        }
        private ZedGraph.ZedGraphControl zedGraph;

        private void InitializeComponent()
        {
            this.zedGraph = new ZedGraph.ZedGraphControl();
            this.SuspendLayout();
            //
            //zedGraph
            //
            this.zedGraph.Dock = System.Windows.Forms.DockStyle.Fill;
            this.zedGraph.Location = new System.Drawing.Point(0, 0);
            this.zedGraph.Name = "Name";
            this.zedGraph.ScrollGrace = 0.0;
            this.zedGraph.ScrollMaxX = 0.0;
            this.zedGraph.ScrollMaxY = 0.0;
            this.zedGraph.ScrollMaxY2 = 0.0;
            this.zedGraph.ScrollMinX = 0.0;
            this.zedGraph.ScrollMinY = 0.0;
            this.zedGraph.ScrollMinY2 = 0.0;
            this.zedGraph.Size = new System.Drawing.Size(732, 461);
            this.zedGraph.TabIndex = 1;
            //
            //component
            //
            this.AutoScaleDimensions = new System.Drawing.SizeF(6f, 13f);
            this.AutoScaleMode = System.Windows.Forms.AutoScaleMode.Font;
            this.ClientSize = new System.Drawing.Size(732, 461);
            this.Controls.Add(this.zedGraph);
            this.Name = "graph";
            this.Text = "test";
            this.ResumeLayout(false);

        }
    }
}
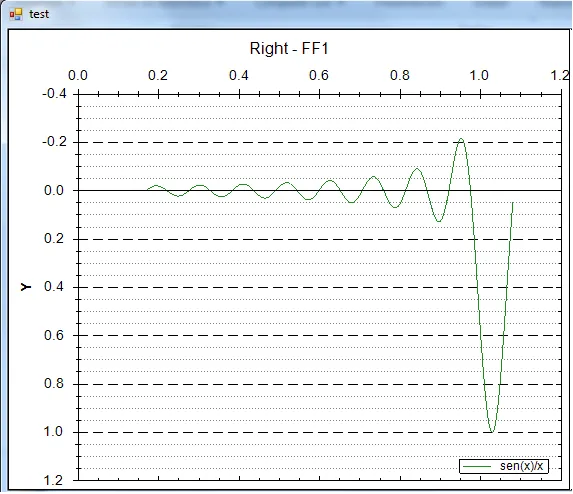
更新
我已经完成了下列操作,问题几乎解决:
    'disable old axis scale
    pane.X2Axis.Scale.IsVisible = False
    pane.X2Axis.MajorTic.IsAllTics = False

    ' new labels
    Dim x_vals = {0.125, 0.25, 0.5, 0.75, 1.0, 1.5, 2.0, 3.0, 4.0, 6.0, 8.0, 12.0, 16.0}

    ' create custom labels and custom grid-lines using LineObj
    For Each val As Double In x_vals

        'add line
        Dim line As New LineObj(pane.YAxis.Scale.Min, val, pane.YAxis.Scale.Max, val)
        line.Line.Style = System.Drawing.Drawing2D.DashStyle.Dash
        line.Line.Width = 1.0F
        pane.GraphObjList.Add(line)
        'add label
        Dim text As New TextObj(val.ToString(), pane.YAxis.Scale.Min, val)
        text.Location.AlignH = AlignH.Right
        text.FontSpec.Border.IsVisible = False
        text.FontSpec.Fill.IsVisible = False
        pane.GraphObjList.Add(text)
    Next
获取: