在R Markdown中呈现ggplotly()

3
使用ggplotly()创建的交互式图表可以很好地与R Markdown中的html_document输出配合使用,例如请参见RMarkdown和ggplotly。但是对于github_document输出,生成的HTML预览文件不会显示ggplotly()图形。
我采用了链接SO帖子中的代码,并仅更改了标题中的输出格式。 有人知道如何在此类输出中正确呈现plotly图形吗? 或者至少,如果可能的话?
---
title: "RmarkdownExample"
author: "fdetsch"
date: "April 16, 2020"
output: github_document
---

Here is the graph I generated. 

```{r setup, message = FALSE, echo = FALSE, warning=FALSE}
# Require
library(plotly)
# Create
dsamp <- diamonds[sample(nrow(diamonds), 1000), ]
# Plot
g <- qplot(carat, price, data=dsamp, colour=clarity)
# Call
ggplotly(g)
```
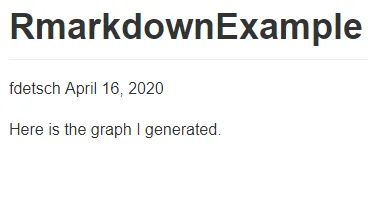
enter image description here

2个回答

2
对于output: github_document,我找到了一个解决方法,可以使用iframe很好地呈现ggplotly()图形。技巧是将plotly小部件导出为HTML,然后将其嵌入为iframe。在我看来,与启用keep_mdoutput: html_document相比,优点是在线.md文件仅打印指向中间HTML文件的链接,而不是完整的小部件代码,使其更加整洁。
---
title: "Render `ggplotly()` graphs in `github_document`"
author: "fdetsch"
date: "`r Sys.Date()`"
output: github_document
---

Here is the graph I generated. 

```{r setup, message = FALSE, echo = FALSE, warning = FALSE}
# Require
library(plotly)
# Create
dsamp <- diamonds[sample(nrow(diamonds), 1000), ]
# Plot
g <- qplot(carat, price, data=dsamp, colour=clarity)
# Call
p <- ggplotly(g)

```

```{r include, echo = FALSE}
htmlwidgets::saveWidget(p, "index.html")

htmltools::tags$iframe(
  src=file.path(getwd(), "index.html"),
  width="100%",
  height="600",
  scrolling="no",
  seamless="seamless",
  frameBorder="0"
)

```

至少在使用外部查看器打开预览HTML时,交互式图形会显示出来。目前RStudio(预览版1.3.938)的查看器无法呈现该图像。


1

似乎github_document存在一些问题,请参见这里。我的解决办法是:将其编织为html_document,并保存结果为*.md文件。 因此,YAML头应为:

---
title: "RmarkdownExample"
author: "fdetsch"
date: "April 16, 2020"
output: 
  html_document:
    keep_md: true
---

您可以使用md文件上传到GitHub。

感谢您指向这个帖子。我同意HTML呈现得很好。然而,在线.md看起来相当混乱。 - fdetsch
没错,我已经找到了一个output: github_document的解决方法,并且也分享了代码。老实说,我认为两个答案都有其合理的地方,这使得很难在它们之间做出选择。 - fdetsch

网页内容由stack overflow 提供, 点击上面的
可以查看英文原文,
原文链接