Tradingview Pine脚本 - 如何使自定义成交量指标的行为像内置的Vol

11

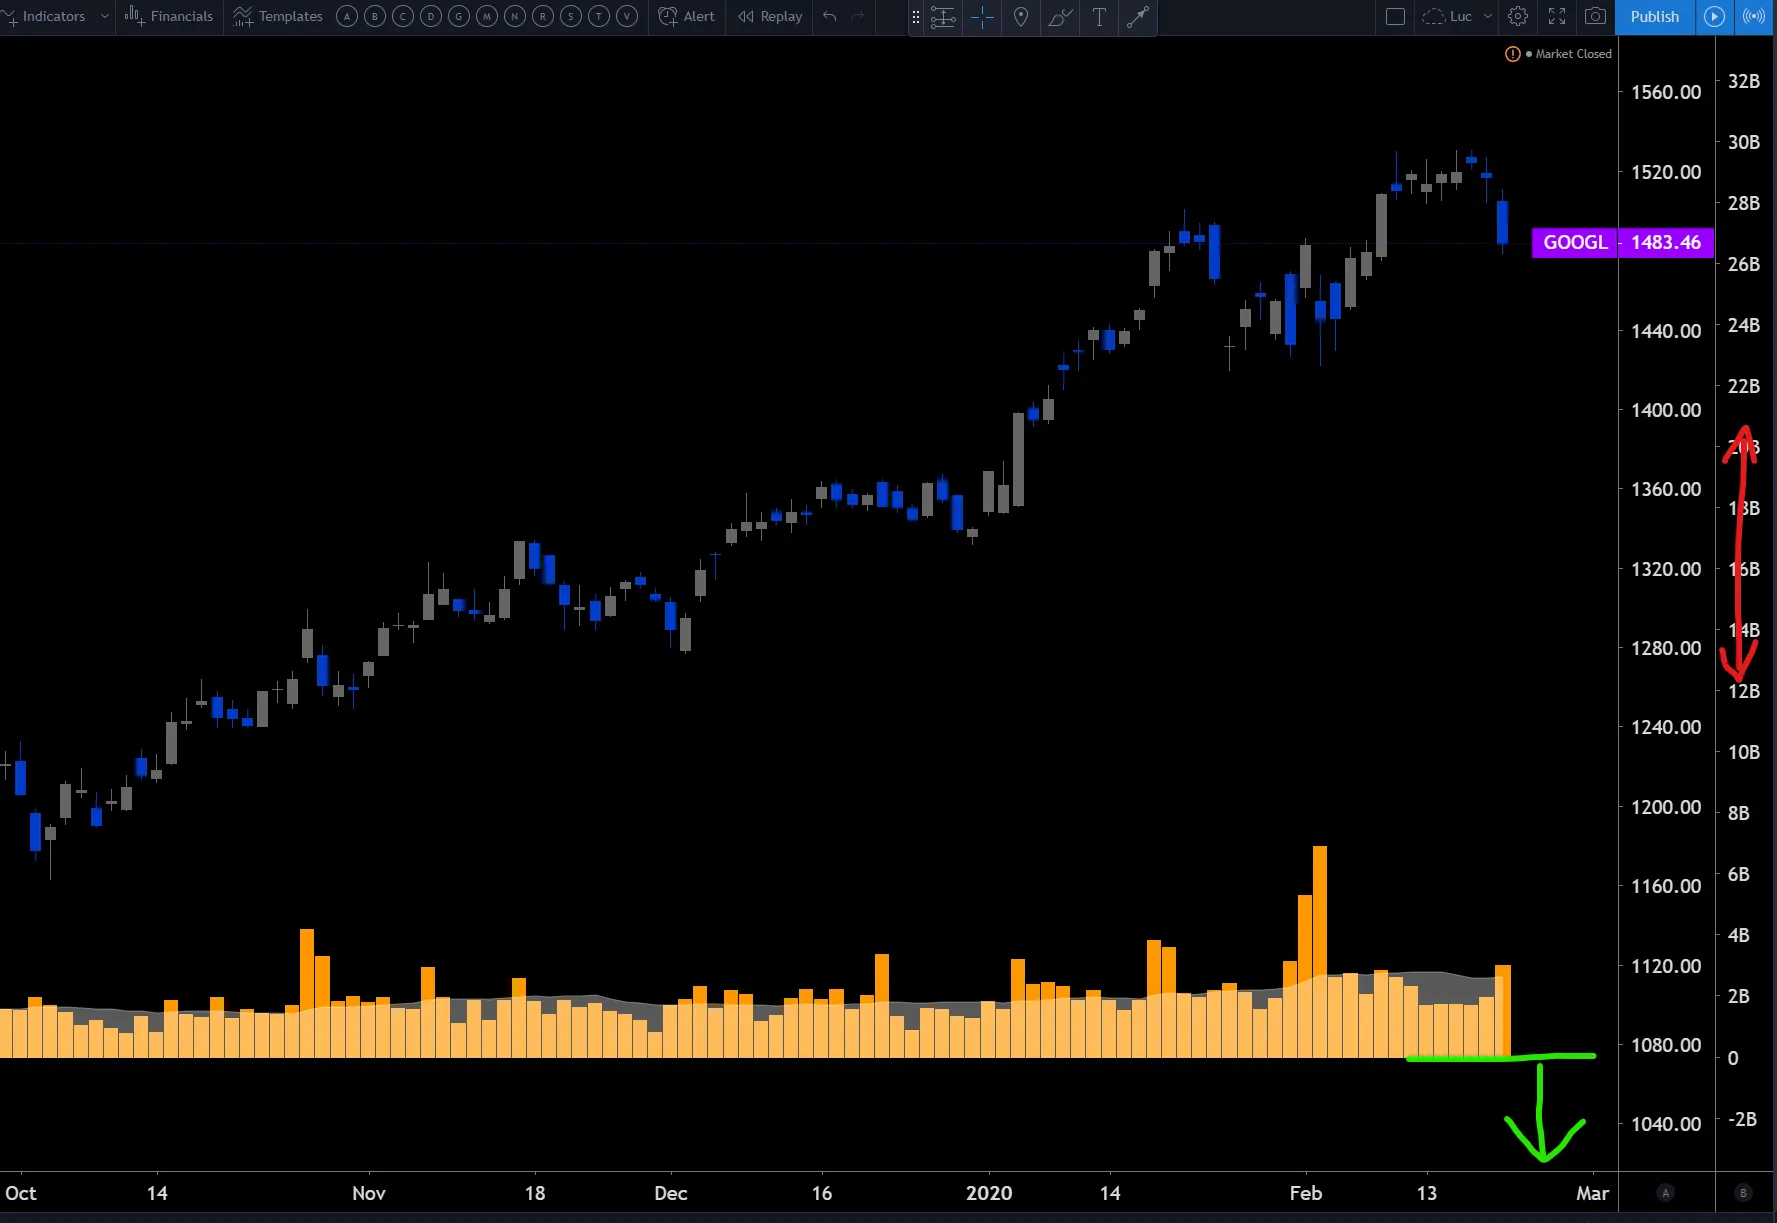
我制作了一个自定义的成交量指标,但在应用于图表时,它不像内置指标一样自动缩放,也不能自动固定在图表面板底部,还需要自己显式添加额外的刻度。

有没有办法让它做到这些事情?

我在原始指标代码中也没有找到任何帮助。例如,当我尝试应用format.volume时,它根本无法编译。

以下是我的代码,原始代码在下面:

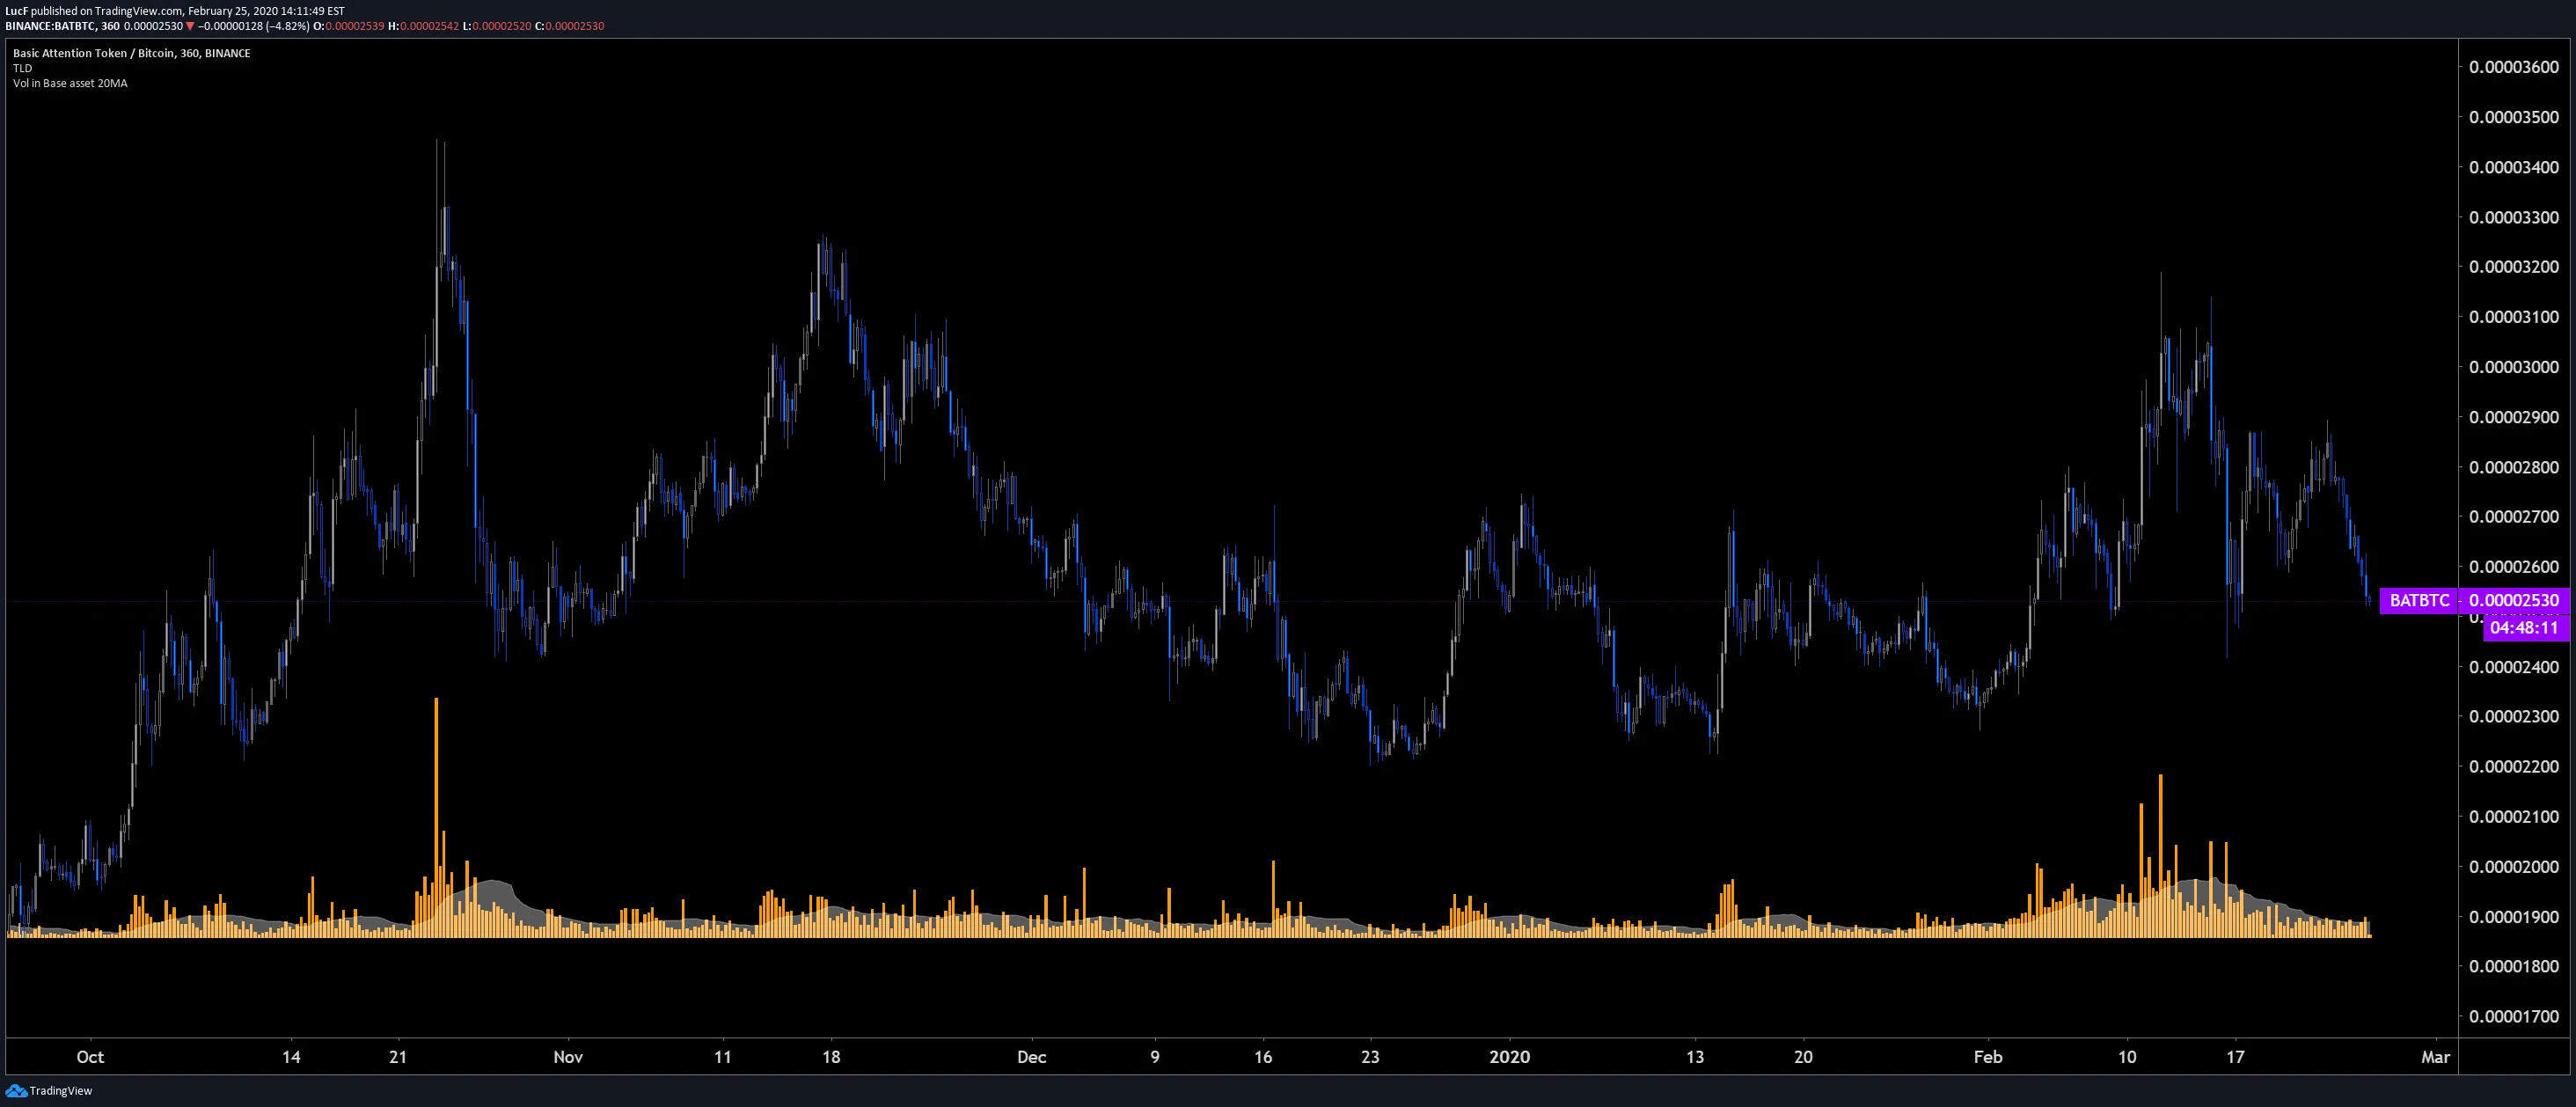
//This inddicator will show volume inversely. So if you are looking at an Altcoin, it will show volume in BTC, if you are looking at for example BTC/USD it will show volume in USD and so on. Works with all altcoins and fiat pairs.
//I find this most useful when shopping for alts to quickly get an idea of their liquidity.

//title the indicator and dont use decimals. (Otherwise when viewing fiat volume you get unreadably large numbers) you can change this in the settings dialog tho if you want.
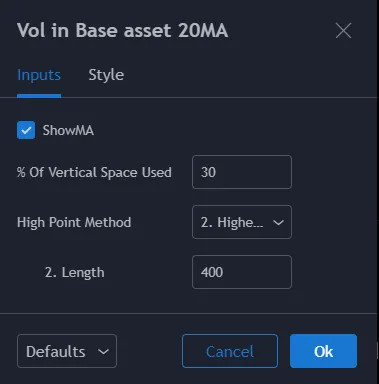
study("Vol in Base asset 20MA", precision=0)

//Make the moving average user configurable
showMA = input(true)

//Get volume for current bar and multiply with vwap
vInverse = volume * vwap

//Plot fiat volume.
plot(vInverse, color = orange, title="VolumeBTC", style=columns, transp=65)

//Plot 20 candle moving average (changable in settings)
plot(showMA ? sma(vInverse,20) : na, color = white, title="Volume MA", style=area, transp=65)

原始代码:

//@version=4
study(title="Volume", shorttitle="Vol", format=format.volume)
showMA = input(true)
barColorsOnPrevClose = input(title="Color bars based on previous close", type=input.bool, defval=false)

palette = barColorsOnPrevClose ? close[1] > close ? color.red : color.green : open > close ? color.red : color.green

plot(volume, color = palette, style=plot.style_columns, title="Volume", transp=65)
plot(showMA ? sma(volume,20) : na, style=plot.style_area, color=color.blue, title="Volume MA", transp=65)
2个回答

10

简短回答你的问题,目前无法完全达到你的要求。为了实现内置音量指标的效果,我们需要两个缺失的东西:

  1. 知道图表上显示哪些柱子的松树可见性(这样我们才能动态调整音量柱子的高度)。
  2. 一种将指标锚定在图表底部但仍允许指标比例自动缩放的方法。

此代码还使用了Michel的scale.none的想法,但它添加了一个不可见的绘图层,允许您确定垂直空间中列的最大高度,而不会缩放列本身的值,因此您仍然可以获得正确 的读数。您可以使用“设置/输入”来:

  • 指定您希望最高列占用的垂直空间的最大百分比。
  • 指定用于调整列比例的最大过去值的确定方式,即使用:
    • 有史以来的最高点,或
    • 最近n根棒杆中的最高柱(默认值为n=400)。第二种方法更适合最近的图表上下文。

enter image description here

//This indicator will show volume inversely. So if you are looking at an Altcoin, it will show volume in BTC, if you are looking at for example BTC/USD it will show volume in USD and so on. Works with all altcoins and fiat pairs.
//I find this most useful when shopping for alts to quickly get an idea of their liquidity.

//title the indicator and dont use decimals. (Otherwise when viewing fiat volume you get unreadably large numbers) you can change this in the settings dialog tho if you want.
//@version=4
study("Vol in Base asset 20MA", "", true, format.volume, 0, scale.none)

//Make the moving average user configurable
HIM1 = "1. Historical High"
HIM2 = "2. Highest in last..."
showMA = input(true)
scaleFactor = 100 / input(30, "% of vertical space used", step = 10, maxval = 100)
hiMethod = input(HIM2, "High point method", options = [HIM1, HIM2])
hiMethod2Len = input(400, "  2. Length", minval = 2, step = 100)

//Get volume for current bar and multiply with vwap
vInverse = volume * vwap

//Plot fiat volume.
plot(vInverse, color = color.orange, title="VolumeBTC", style=plot.style_columns, transp=0) //Originally: transp=65

//Plot 20 candle moving average (changable in settings)
plot(showMA ? sma(vInverse,20) : na, color = color.white, title="Volume MA", style=plot.style_area, transp=65)

//Plot high line to scale down the columns.
var histHi = 0.
histHi := max(histHi, nz(vInverse, histHi))
limit = hiMethod == HIM1 ? histHi : highest(vInverse, hiMethod2Len)
plot(limit * scaleFactor, "Historical High", #00000000)

这将会得到类似于这样的效果:

enter image description here

有两种方法可以让图表的列底部对齐,但都不是理想的:

  1. 使用图表的 设置/外观/底边距 将图表的底部边距设置为0%,但是这样会导致图表条形继续重叠。
  2. 通过拖动独立刻度盘的刻度线将其缩小一些(红色箭头)。然后在图表上抓住列(绿色箭头)并将它们下移,但这样会使独立刻度盘冻结,因此当您更改符号并且成交量增加/减少时,它不会自动调整大小。

enter image description here

将指标与垂直空间底部对齐的能力已被 TV 识别为潜在的改进方向,但目前没有时间表。


"ETA" 的意思是什么? - carloswm85
1
预计到达时间。 - PineCoders-LucF

2

你漏掉了一些额外的内容。

首先,你应该放置所使用的松树版本。有一个特殊的字符串://@version=4 如果没有设置该字符串,则代码被视为版本1,该版本不具备format参数。

要关闭自动缩放,您应将scale参数设置为scale.none。请注意,仅当overlay参数为true时才有效。

要使用版本4,颜色名称前应添加color.前缀:color.orange,绘图样式应添加前缀plot.style_plot.style_area

// NOTE: THE STRING WITH VERSION BELOW IS IMPORTANT!
//@version=4

// to turn the scale off scale.none is used. Note, that it might be only applied
// if the overlay param is 'true'
study(title="Volume", shorttitle="Vol", format=format.volume, overlay=true, scale=scale.none)

showMA = input(true)

vInverse = volume * vwap

// colors must have the prefix 'color.' before the color names
plot(vInverse, color = color.orange, title="VolumeBTC", style=plot.style_columns, transp=65)
plot(showMA ? sma(vInverse,20) : na, color = color.white, title="Volume MA", style=plot.style_area, transp=65)

网页内容由stack overflow 提供, 点击上面的
可以查看英文原文,
原文链接