是否有可以添加到Matlab GUI的现成进度条UI控件,无论是UI控件还是ActiveX组件?
[编辑]我知道waitbar函数,我的意思是可以实现到设计的GUI中而不仅仅是弹出窗口的组件。就像状态栏中的电池状态一样。
是否有可以添加到Matlab GUI的现成进度条UI控件,无论是UI控件还是ActiveX组件?
[编辑]我知道waitbar函数,我的意思是可以实现到设计的GUI中而不仅仅是弹出窗口的组件。就像状态栏中的电池状态一样。
Waitbar及其变体显示带有状态栏的弹出窗口。在大多数应用程序中,这很简单易用。
如果您想在现有GUI窗口中集成进度条,则有几个选择:
所有这些选择都适用于所有Matlab平台。
我从这篇MatLab新闻组的评论中改编了我的代码,得到了以下内容:
function h = uiProgressBar(varargin)
%uiProgressBar: A waitbar that can be embedded in a GUI figure.

    if ishandle(varargin{1}) && size(varargin, 2) > 1
        ax = varargin{1};
        value = varargin{2};
        p = get(ax,'Child');
        x = get(p,'XData');
        x(3:4) = value;
        set(p,'XData',x)
        return
    end

    bg_color = 'w';
    fg_color = 'r';
    h = axes('Units','pixels',...
        'XLim',[0 1],'YLim',[0 1],...
        'XTick',[],'YTick',[],...
        'Color',bg_color,...
        'XColor',bg_color,'YColor',bg_color, ...
        'Parent', varargin{1});
    patch([0 0 0 0],[0 1 1 0],fg_color,...
        'Parent',h,...
        'EdgeColor','none',...
        'EraseMode','none');
end
parent 是您要将其添加到的父面板:myProgressBar = uiProgressBar(parent);
uiProgressBar(myProgressBar, .2);
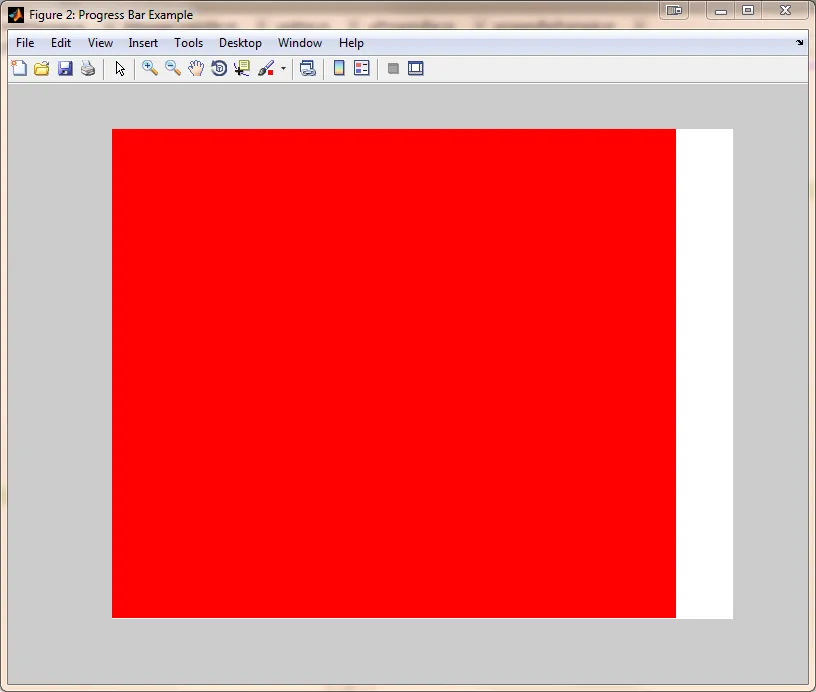
figure的完整工作示例:f = figure('Name', 'Progress Bar Example', 'Position', [100 100 800 600]);
progressBar = uiProgressBar(f);
for i = 1:10:100
uiProgressBar(progressBar, i/100);
pause(.5);
end
另一个简单的解决方案是使用两个嵌套的uipanels,如下所示:
function MyProgressBar(handle, progress)
   % progress = 0.00001 .... 1

   % 1st panel
   p = uipanel(handle);

   % 2n panel as bar
   bar = uipanel(p);
    set(bar, 'BackgroundColor', 'red');
    x = get(bar, 'Position');
    x(3) = progress;       % Corresponds to % progress if unit = normalized
    set(bar, 'Position',x);
end
使用方法:
 f = figure();
 set(f,'Position',[100,100,400,40]);
 MyProgressBar(f, 0.5); % corresponds to 50% progress
如果还有人感兴趣,这是我的解决方案,使用了一个类:
classdef progressbar < handle
    properties(Access = protected)
        h_panel         % Panel on which everything sits
        h_ax            % The progress range axes
        h_pbar          % The bar representing progress (patch)
        h_ptext         % Percentage label
    end
    properties(Access = public, Dependent = true)
        range           % Progress range
        pvalue          % Current value
        percent         % Percentage complete (relative within range)
        position        % Position of the object (panel)
        ax_tag          % Tag of the axes
        visible         % Is the object (panel) visible?
    end
    properties(Constant = true)
        default_color = [.75 .75 .9];
    end
    methods
        % Initializer
        function obj = progressbar(fig, pos, range)
            if nargin < 3
                range = [0 1];
            end
            obj.h_panel = uipanel('Parent', fig, 'Units', 'Inches', ...
                'Position', pos, 'Tag', 'progbar_panel');
            obj.h_ax = axes('Parent', obj.h_panel, ...
                'Units', 'Inches', 'Position', [0 0 obj.position(3) obj.position(4)], ...
                'XTickLabel', '', 'XTick', [], 'YTickLabel', '', 'YTick', []);
            obj.h_pbar = patch([range(1) range(1) range(1) range(1)], [0 0 2 2], ...
                obj.default_color, 'Parent', obj.h_ax, 'Tag', 'progbar_patch');
            obj.h_ptext = text(obj.position(3)/2, obj.position(4)/2, '0%', ...
                'Parent', obj.h_ax, 'FontWeight', 'bold', 'Units', 'Inches', ...
                'HorizontalAlignment', 'center', 'Tag', 'progbar_text');
            obj.range = range;
            obj.ax_tag = 'progbar_ax';
        end

        % Property Access Methods
        function set.range(obj, value)
            % Instead of replotting, just reset the XLim to the
            % extremities of the input range. If the values are not
            % increasing, just default to [0 1].
            if value(end) > value(1)
                set(obj.h_ax, 'XLim', value([1,end]), 'YLim', [0 2]);
            else
                set(obj.h_ax, 'XLim', [0 1], 'YLim', [0 2]);
            end
            % Reset progress.
            obj.pvalue = value(1);
        end
        function value = get.range(obj)
            value = get(obj.h_ax, 'XLim');
        end
        function set.pvalue(obj, value)
            % Expects a single value to represent progress value and
            % constructs the selection rectangle from that. If multiple
            % values are passed in, all are ignored but the last, since the
            % left edge of the bar is always the first element of the
            % range.
            set(obj.h_pbar, 'XData', [obj.range(1) value(end) value(end) obj.range(1)], ...
                'FaceColor', obj.default_color);
            set(obj.h_ptext, 'String', sprintf('%3.0f%%', obj.percent * 100));
        end
        function value = get.pvalue(obj)
            % The progress bar is actually 2D, but we treat as if it is 1D.
            % Hence the XData is actually an array of four values but we
            % only consider the second (progress maximum).
            limits = get(obj.h_pbar, 'XData');
            value = limits(2);
        end
        function set.percent(obj, value)
            % Expects a single value between 0 and 1.
            limits = obj.range;
            obj.pvalue = value * (limits(2) - limits(1)) + limits(1);
        end
        function value = get.percent(obj)
            limits = obj.range;
            value = (obj.pvalue - limits(1)) / (limits(2) - limits(1));
        end
        function set.position(obj, value)
            set(obj.h_panel, 'Position', value);
        end
        function value = get.position(obj)
            value = get(obj.h_panel, 'Position');
        end
        function set.ax_tag(obj, value)
            set(obj.h_ax, 'Tag', value);
        end
        function value = get.ax_tag(obj)
            value = get(obj.h_ax, 'Tag');
        end
        function set.visible(obj, value)
            if (isnumeric(value) && value >= 1) || strcmp(value, 'on') == 1 || strcmp(value, 'On') == 1
                set(obj.h_panel, 'Visible', 'on');
            else
                set(obj.h_panel, 'Visible', 'off');
            end
        end
        function value = get.visible(obj)
            vis = get(obj.h_panel, 'Visible');
            value = strcmp(vis, 'on');
        end

        % Public member functions
        function increment(obj)
            % Don't use this if the range is less than 1.
            obj.pvalue = obj.pvalue + 1;
        end
        function display_text(obj, text, color)
            if nargin == 3 && ~isempty(color)
                set(obj.h_pbar, 'FaceColor', color);
            end
            set(obj.h_ptext, 'String', text);
        end
    end
end
像这样声明一个实例: pb = progressbar(gcf, [1 1], [0 20]);
它可以用相对或实际数字,例如在我的示例中,pb.pvalue = 10;和pb.percent = .5;的作用相同。
我的版本在进度条中间显示当前百分比的文本对象。
我最新的版本可以在这里找到。
http://www.mathworks.com/matlabcentral/fileexchange/26773-progress-bar&watching=26773
http://www.mathworks.com/matlabcentral/fileexchange/3607-progressbar
还有另一种方法...如果我错过了提到它的话,对不起。您可以动态构建一个图形,为条形添加轴...它非常好用,很容易适应自定义应用程序。弹出窗口总是会丢失或妨碍。