动态布局不会在窗口调整大小之前传播重新调整的图形尺寸。

7
在下面这个示例的Dash应用程序中,我试图创建一个动态布局,并且具有可变数量的行和列。这种动态的网格式布局将被各种可以通过下拉菜单等进行修改的图表填充。
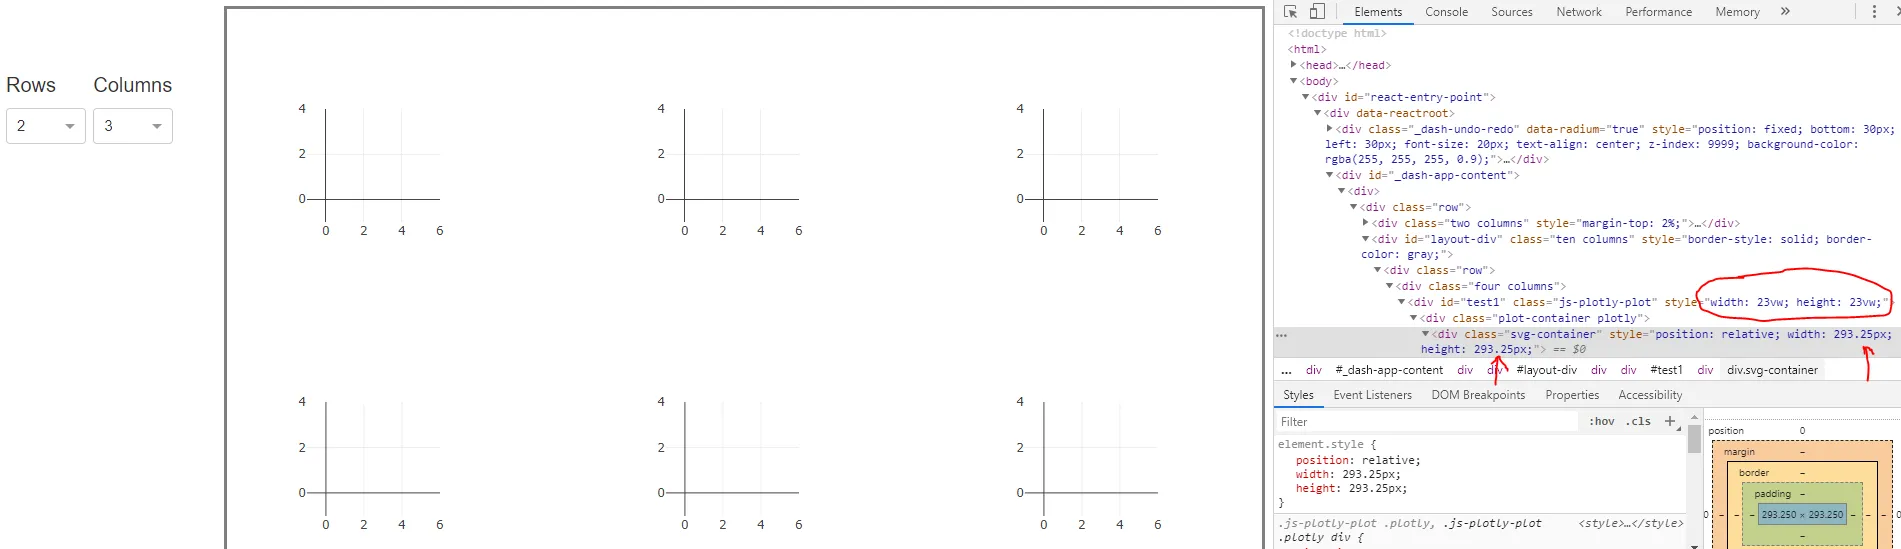
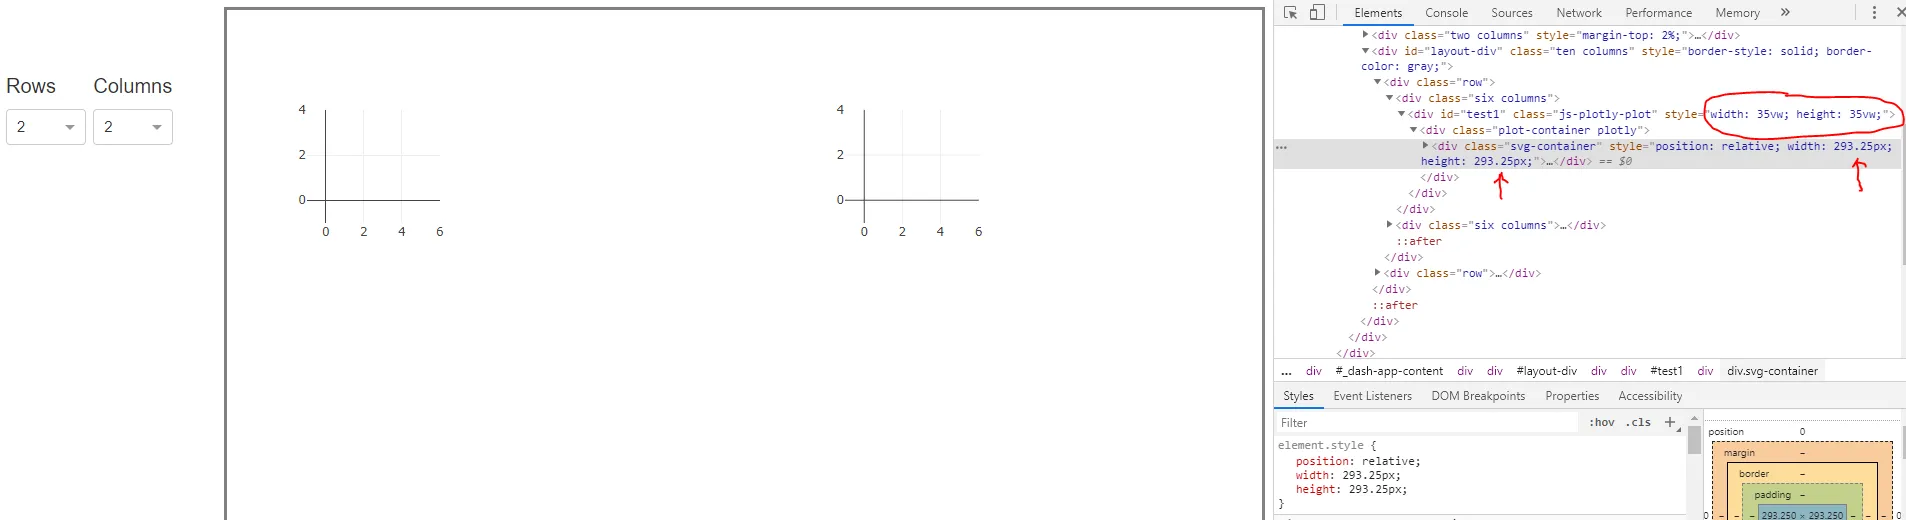
到目前为止,我遇到的主要问题与视口单位有关,并尝试适当地样式化各个图表以适应动态布局。例如,我通过视口单位修改dcc.Graph()组件的样式,其中维度(例如高度和宽度)可能是35vw或23vw,这取决于列的数量。例如,当我将列数从3更改为2时,dcc.Graph()组件的高度和宽度显然已更改,但是在实际呈现的布局中,此更改直到调整窗口大小后才会反映出来(请参见示例代码下面的图像)。
如何强制dcc.Graph()组件在不必调整窗口大小的情况下传播这些更改?
import dash
import dash_core_components as dcc
import dash_html_components as html
from dash.dependencies import Input, Output, State

external_stylesheets = ['https://codepen.io/chriddyp/pen/bWLwgP.css']

app = dash.Dash(__name__, external_stylesheets=external_stylesheets)
app.config.suppress_callback_exceptions = True

app.layout = html.Div([

    html.Div(className='row', children=[

        html.Div(className='two columns', style={'margin-top': '2%'}, children=[

            html.Div(className='row', style={'margin-top': 30}, children=[

                html.Div(className='six columns', children=[

                    html.H6('Rows'),

                    dcc.Dropdown(
                        id='rows',
                        options=[{
                            'label': i,
                            'value': i
                        } for i in [1,2,3,4]],
                        placeholder='Select number of rows...',
                        clearable=False,
                        value=2
                    ),

                ]),

                html.Div(className='six columns', children=[

                    html.H6('Columns'),

                    dcc.Dropdown(
                        id='columns',
                        options=[{
                            'label': i,
                            'value': i
                        } for i in [1,2,3]],
                        placeholder='Select number of columns...',
                        clearable=False,
                        value=3
                    ),

                ])

            ]),

        ]),

        html.Div(className='ten columns', id='layout-div', style={'border-style': 'solid', 'border-color': 'gray'}, children=[])

    ])

])

@app.callback(
    Output('layout-div', 'children'),
    [Input('rows', 'value'),
    Input('columns', 'value')])
def configure_layout(rows, cols):

    mapping = {1: 'twelve columns', 2: 'six columns', 3: 'four columns', 4: 'three columns'}
    sizing = {1: '40vw', 2: '35vw', 3: '23vw'}

    layout = [html.Div(className='row', children=[

        html.Div(className=mapping[cols], children=[

            dcc.Graph(
                id='test{}'.format(i+1+j*cols),
                config={'displayModeBar': False},
                style={'width': sizing[cols], 'height': sizing[cols]}
            ),

        ]) for i in range(cols)

    ]) for j in range(rows)]

    return layout

#Max layout is 3 X 4
for k in range(1,13):

    @app.callback(
        [Output('test{}'.format(k), 'figure'),
        Output('test{}'.format(k), 'style')],
        [Input('columns', 'value')])
    def create_graph(cols):

        sizing = {1: '40vw', 2: '35vw', 3: '23vw'}

        style = {
            'width': sizing[cols],
            'height': sizing[cols],
        }

        fig = {'data': [], 'layout': {}}

        return [fig, style]

if __name__ == '__main__':
    app.server.run()

相关截图(图1-页面加载,图2 - 切换列数):

请输入图片描述

请输入图片描述


可能与此问题相关:https://github.com/plotly/plotly.js/issues/2769 使用px而不是vw似乎是有效的。可能强制重新绘制图表是唯一的方法。 - Maximilian Peters
除了手动调整窗口大小外,您是否知道强制重绘图形的任何方法?换句话说,我该如何触发重绘? - rahlf23
window.dispatchEvent(new Event('resize'));,具有讽刺意味的是它会抛出错误但仍能正常工作。不幸的是,我不知道如何从Dash中轻松调用此行JS,除非创建一个新组件。 - Maximilian Peters
2个回答

5

以下是操作步骤:

app.py文件必须导入:

from dash.dependencies import Input, Output, State, ClientsideFunction

让我们将下面的 Div 包含到 Dash 布局中:

html.Div(id="output-clientside"),

asset文件夹必须包含你自己的脚本或默认的脚本resizing_script.js,该脚本包含以下内容:

if (!window.dash_clientside) {
    window.dash_clientside = {};
}
window.dash_clientside.clientside = {
    resize: function(value) {
        console.log("resizing..."); // for testing
        setTimeout(function() {
            window.dispatchEvent(new Event("resize"));
            console.log("fired resize");
        }, 500);
    return null;
    },
};

在你的回调函数中,放置这个没有@符号的函数:

app.clientside_callback(
    ClientsideFunction(namespace="clientside", function_name="resize"),
    Output("output-clientside", "children"),
    [Input("yourGraph_ID", "figure")],
)    

在这一点上,当您手动调整浏览器窗口大小时,浏览器会触发调整大小功能。
我们的目标是实现相同的结果,但不需要手动调整窗口大小。例如,触发器可以是className更新。
因此,我们应用以下更改: 步骤1:未变 步骤2:未变 步骤3:让我们在我们的javascript文件中添加一个“resize2”函数,它接受2个参数。
if (!window.dash_clientside) {
  window.dash_clientside = {};
}
window.dash_clientside.clientside = {
  resize: function(value) {
    console.log("resizing..."); // for testing
    setTimeout(function() {
      window.dispatchEvent(new Event("resize"));
      console.log("fired resize");
    }, 500);
    return null;
  },

  resize2: function(value1, value2) {
    console.log("resizingV2..."); // for testing
    setTimeout(function() {
       window.dispatchEvent(new Event("resize"));
       console.log("fired resizeV2");
    }, 500);
    return value2; // for testing
  }
};

函数“resize2”现在需要2个参数,分别对应下面回调函数中定义的每个输入。它将返回指定在此回调函数中的输出“value2”的值。您可以将其设置回“null”,这只是为了说明。

第4步:我们回调函数现在变成:

app.clientside_callback(
    ClientsideFunction(namespace="clientside", function_name="resize2"),
    Output("output-clientside", "children"),
    [Input("yourGraph_ID", "figure"), Input("yourDivContainingYourGraph_ID", "className")],
)    

最后,您需要一个按钮来触发事件,该事件将更改容器的类名。
比如说,您有以下代码:
daq.ToggleSwitch(
    id='switchClassName',
    label={
        'label':['Option1', 'Option2'],
    },          
    value=False,                                          
),  

以下是回调函数:

@app.callback(Output("yourDivContainingYourGraph_ID", "className"), 
              [Input("switchClassName","value")]
              )
def updateClassName(value):
    if value==False:
        return "twelve columns"
    else:
        return "nine columns"

现在,如果您保存所有内容并刷新页面,每次按下 toggleSwitch 按钮,它会重新调整容器大小、触发函数并刷新图形。
考虑到它的实现方式,我相信也可以运行更多 JavaScript 函数,但我还没有验证。
希望这些能对您有所帮助。

我曾经遇到同样的问题,这个方法对我有用,David!!! 谢谢你的出色工作,David,非常感激。 - Leonardo Ferreira

3
这个行为对我来说看起来像是一个 Plotly 的 bug。
以下是可能的解决方法/短期解决方案。
有一个不错的库叫做 visdcc,它允许使用 Javascript 进行回调。您可以通过以下方式安装它: pip install visdcc 将其添加到您的 div 中:

visdcc.Run_js(id='javascript'),

并添加回调函数

@app.callback(
    Output('javascript', 'run'),
    [Input('rows', 'value'),
     Input('columns', 'value')])
def resize(_, __): 
    return "console.log('resize'); window.dispatchEvent(new Event('resize'));"

Plotly会在resize事件后(手动调整窗口大小时也会发生)在控制台中抛出错误,但是图表会正确显示。 完整代码
import dash
import dash_core_components as dcc
import dash_html_components as html
from dash.dependencies import Input, Output, State
import visdcc

SIZING = {1: '40vw', 2: '35vw', 3: '23vw'}

external_stylesheets = ['https://codepen.io/chriddyp/pen/bWLwgP.css']

app = dash.Dash(__name__, external_stylesheets=external_stylesheets)
app.config.suppress_callback_exceptions = True

app.layout = html.Div([
    visdcc.Run_js(id='javascript'),
    html.Div(className='row', children=[

        html.Div(className='two columns', style={'margin-top': '2%'}, children=[

            html.Div(className='row', style={'margin-top': 30}, children=[

                html.Div(className='six columns', children=[

                    html.H6('Rows'),

                    dcc.Dropdown(
                        id='rows',
                        options=[{
                            'label': i,
                            'value': i
                        } for i in [1,2,3,4]],
                        placeholder='Select number of rows...',
                        clearable=False,
                        value=2
                    ),

                ]),

                html.Div(className='six columns', children=[

                    html.H6('Columns'),

                    dcc.Dropdown(
                        id='columns',
                        options=[{
                            'label': i,
                            'value': i
                        } for i in [1,2,3]],
                        placeholder='Select number of columns...',
                        clearable=False,
                        value=3
                    ),

                ])

            ]),

        ]),

        html.Div(className='ten columns', id='layout-div', style={'border-style': 'solid', 'border-color': 'gray'}, children=[])

    ])

])


@app.callback(
    Output('layout-div', 'children'),
    [Input('rows', 'value'),
    Input('columns', 'value')])
def configure_layout(rows, cols):

    mapping = {1: 'twelve columns', 2: 'six columns', 3: 'four columns', 4: 'three columns'}

    layout = [html.Div(className='row', children=[

        html.Div(className=mapping[cols], style={'width': SIZING[cols], 'height': SIZING[cols]}, children=[

            dcc.Graph(
                id='test{}'.format(i+1+j*cols),
                config={'displayModeBar': False},
                style={'width': SIZING[cols], 'height': SIZING[cols]}
            ),

        ]) for i in range(cols)

    ]) for j in range(rows)]
    return layout

@app.callback(
    Output('javascript', 'run'),
    [Input('rows', 'value'),
     Input('columns', 'value')])
def resize(_, __): 
    return "console.log('resize'); window.dispatchEvent(new Event('resize'));"


#Max layout is 3 X 4
for k in range(1,13):

    @app.callback(
        [Output('test{}'.format(k), 'figure'),
         Output('test{}'.format(k), 'style')],
        [Input('columns', 'value')])
    def create_graph(cols):

        style = {
            'width': SIZING[cols],
            'height': SIZING[cols],
        }

        fig = {'data': [], 'layout': {}}
        return [fig, style]

if __name__ == '__main__':
    app.server.run()

1
这是一个很好的临时解决方案!我感谢你详尽的回答。目前我可以接受在控制台打印错误,因为我的最终用户可能不知道如何访问开发者工具。 - rahlf23
1
随着在Dash中实现ClientsideFunction,@David22的答案是解决此问题更直接的方法。在新解决方案出现之前,您提供的解决方法已经足够了。再次感谢! - rahlf23

网页内容由stack overflow 提供, 点击上面的
可以查看英文原文,
原文链接