我正在处理一个与以下数据集对应的数据提取:
set.seed(1)
df <- data.frame(indicator=runif(n = 100),cohort=letters[1:4],
                 year=rep(1976:2000, each=4))
我希望为数据集中每个代表一个cohort的变量生成一个百分比同比增长率。我尝试使用以下代码(来自此讨论):
df$ind_per_chng <- transform(new.col=c(NA,indicator[-1]/indicator[-nrow(df)]-1))
但我对在每个子组中使其运作并仅生成一个额外的列以显示百分比变化非常感兴趣,而不是目前创建的一组列。
> head(df)
  indicator cohort year ind_per_chng.indicator ind_per_chng.cohort ind_per_chng.year
1 0.2655087      a 1976              0.2655087                   a              1976
2 0.3721239      b 1976              0.3721239                   b              1976
3 0.5728534      c 1976              0.5728534                   c              1976
4 0.9082078      d 1976              0.9082078                   d              1976
5 0.2016819      a 1977              0.2016819                   a              1977
6 0.8983897      b 1977              0.8983897                   b              1977
  ind_per_chng.new.col
1                   NA
2            0.4015509
3            0.5394157
4            0.5854106
5           -0.7779342
6            3.4544877
编辑
为了回答有用的评论,输出的格式应与下表对应:
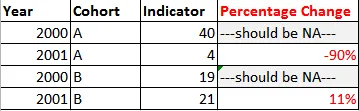
原始data.frame没有其他更改,除了提供每个年级对所选变量的百分比变化值的列。