寻找R中距离所有其他点最远的点

10

我在寻找解决这个简单问题的方法,我已经在论坛上搜索了一番,虽然我离答案更近了,但这不是我所需要的。

我试图从一组x,y点中找出哪一个点距离其他点最远,即不是点之间的最大距离,而是离其他点最远的那个点。

我已经尝试过

x <-c(x1,x2,x3....)
y <-c(y1,y2,y3...)
dist(cbind(x,y))

这使我得到了每个点之间距离的矩阵。我可以在 MS Excel 中查询数据并找到答案。找到每列中的最小值,然后找到它们之间的最大值。

enter image description here

如果我想绘制数据,我希望输出红线或蓝线的距离(取决于哪条更长)。

enter image description here


1
我不确定这个问题的规范是否恰当。你使用的是哪个函数来聚合从特定点到其他点的距离? - lmo
你对REST的定义是什么?因为本质上,你正在尝试找到在整个数据集中是异常值的观察结果。通常,人们会通过找到只在单个列(变量/特征)方面更远的观察结果来做到这一点,但你正在尝试与整个“blob”进行比较,明白吗? - Guilherme Marthe
抱歉如果问题不够清晰 - 我在原帖中添加了一张图片,希望能展示我想要做的事情。谢谢您的帮助。 - Adam
1
通过对数据进行查询,我可以查找每个点与任何其他点之间的最小距离,然后查找所有最小值中的最大距离。 - Adam
@amonk 我可能误解了问题,还是...?因为我看到的答案完全不同... - amonk
显示剩余2条评论
6个回答

4
从这个数据集开始:
set.seed(100)
x <- rnorm(150)
y <- rnorm(150)
coord <- cbind(x,y)
dobj <- dist(coord)

现在,dobj 是一个距离对象,但是你不能直接检查它。你需要先将其转换为矩阵,并确保不考虑点与自身之间的零距离:
dmat <- as.matrix(dobj)
diag(dmat) <- NA

后一行将距离矩阵中的对角线值替换为NA

现在您可以使用amonk的解决方案:

dmax <- max(apply(dmat,2,min,na.rm=TRUE))

这将为您提供到最近点的最大距离。如果您想知道这些点是哪些,可以进行额外步骤:
which(dmat == dmax, arr.ind = TRUE)
#     row col
# 130 130  59
# 59   59 130

因此,点130和59是满足您条件的两个点。绘制如下图所示:
id <- which(dmat == dmax, arr.ind = TRUE) 
plot(coord)
lines(coord[id[1,],], col = 'red')

请注意,您会得到这些信息两次,因为两点之间的欧几里得距离是对称的(A -> B 和 B -> A 的长度相同)。 enter image description here

1

如果你的初始数据框是df,你可以执行以下操作:

df<-NULL#initialize object 
for(i in 1:10)#create 10 vectors with 10 pseudorandom numbers each
  df<-cbind(df,runif(10))#fill the dataframe

cordf<-cor(df);diag(cordf)<-NA #create correlation matrix and set diagonal values to NA

因此:

             [,1]        [,2]        [,3]        [,4]        [,5]        [,6]        [,7]        [,8]        [,9]       [,10]
[1,]          NA -0.03540916 -0.29183703  0.49358124  0.79846794  0.29490246  0.47661166 -0.51181482 -0.04116772 -0.10797632
[2,] -0.03540916          NA  0.47550478 -0.24284088 -0.01898357 -0.67102287 -0.46488410  0.01125144  0.13355919  0.08738474
[3,] -0.29183703  0.47550478          NA -0.05203104 -0.26311149  0.01120055 -0.16521411  0.49215496  0.40571893  0.30595246
[4,]  0.49358124 -0.24284088 -0.05203104          NA  0.60558581  0.53848638  0.80623397 -0.49950396 -0.01080598  0.41798727
[5,]  0.79846794 -0.01898357 -0.26311149  0.60558581          NA  0.33295170  0.53675545 -0.54756131  0.09225002 -0.01925587
[6,]  0.29490246 -0.67102287  0.01120055  0.53848638  0.33295170          NA  0.72936185  0.09463988  0.14607018  0.19487579
[7,]  0.47661166 -0.46488410 -0.16521411  0.80623397  0.53675545  0.72936185          NA -0.46348644 -0.05275132  0.47619940
[8,] -0.51181482  0.01125144  0.49215496 -0.49950396 -0.54756131  0.09463988 -0.46348644          NA  0.64924510  0.06783324
[9,] -0.04116772  0.13355919  0.40571893 -0.01080598  0.09225002  0.14607018 -0.05275132  0.64924510          NA  0.44698207
[10,] -0.10797632  0.08738474  0.30595246  0.41798727 -0.01925587  0.19487579  0.47619940  0.06783324  0.44698207          NA

最终通过执行以下命令:
   max(apply(cordf,2,min,na.rm=TRUE),na.rm = TRUE)#avoiding NA's 

一个可以得到:

[1] -0.05275132

最大值是“局部”最小值。

编辑:

为了获取矩阵的索引
>which(cordf==max(apply(cordf,2,min,na.rm=TRUE),na.rm = TRUE))
[1]68 77 

或者为了获得坐标:
> which(cordf==max(apply(cordf,2,min,na.rm=TRUE),na.rm = TRUE), arr.ind = TRUE)
     row col
[1,]   8   7
[2,]   7   8

1
请用TRUE代替T。在控制台中输入T <- FALSE,然后再次运行代码以查看原因。 - Joris Meys

1

在我看来,你的空间点是以某种投影方式表示的。有人可能会说,与其他点最远的那个点,就是距离中心点(平均坐标)最远的点:

library(raster)

set.seed(21)

# create fake points
coords <- data.frame(x=sample(438000:443000,10),y=sample(6695000:6700000,10))

# calculate center
center <- matrix(colMeans(coords),ncol=2)

# red = center, magenta = furthest point (Nr.2)
plot(coords)

# furthest point #2
ix <- which.max(pointDistance(coords,center,lonlat = F))

points(center,col='red',pch='*',cex=3)
points(coords[ix,],col='magenta',pch='*',cex=3)

segments(coords[ix,1],coords[ix,2],center[1,1],center[1,2],col='magenta')

enter image description here


1
这在数学上是不正确的。并不是因为一个点距离中心最远,那么从该点到另一个点的最小距离就是两个点之间的最大最小距离。在我的示例上尝试您的代码,您会发现选择了错误的点。 - Joris Meys

1
要找到与其他点最远的点,您可以这样做。我选择了中位距离,因为您说了点与其他数据最远。如果有一组非常接近的点,则中位数应该对此保持稳健。
可能也有一种使用分层聚类的方法,但目前我无法想起来。
set.seed(1234)
mat <- rbind(matrix(rnorm(100), ncol=2), c(-5,5), c(-5.25,4.75))
d <- dist(mat)
sort(apply(as.matrix(d), 1, median), decreasing = T)[1:5]
# 51       52       20       12        4 
# 6.828322 6.797696 3.264315 2.806263 2.470919 

1

我写了一个方便的小函数,可以用来选择最大的行距。你可以使用n参数指定你想要最大的、第二大的等等。

getBigSegment <- function(x, y, n = 1){
  a <- cbind(x,y)
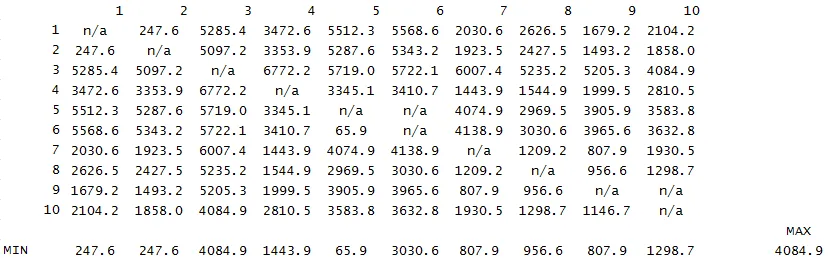
  d <- as.matrix(dist(a, method = "euclidean"))
  sorted <- order(d, decreasing = T)
  sub <- (1:length(d))[as.logical(1:length(sorted) %% 2)]
  s <- which(d == d[sorted[sub][n]], arr.ind = T)
  t(cbind(a[s[1],], a[s[2],]))
}

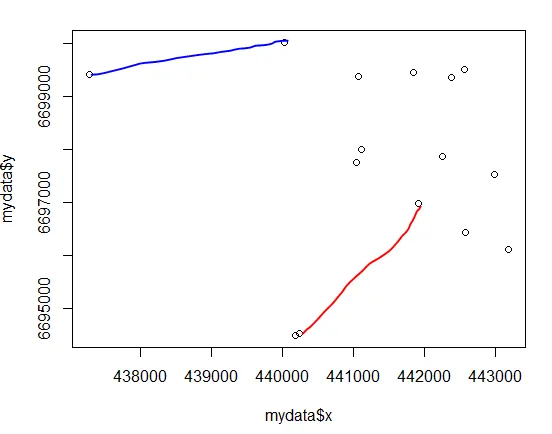
有一些类似于您自己的示例数据,您可以看到:

set.seed(100)
mydata <- data.frame(x = runif(10, 438000, 445000) + rpois(10, 440000), 
                     y = runif(10, 6695000, 6699000) + rpois(10, 6996000))

# The function
getBigSegment(mydata$x, mydata$y)
#            x        y
#[1,] 883552.8 13699108
#[2,] 881338.8 13688458    

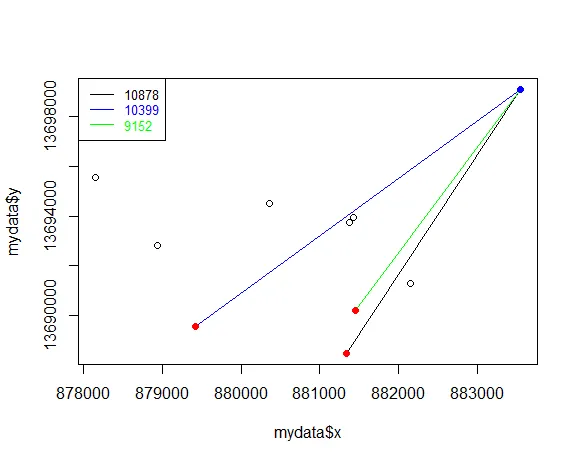
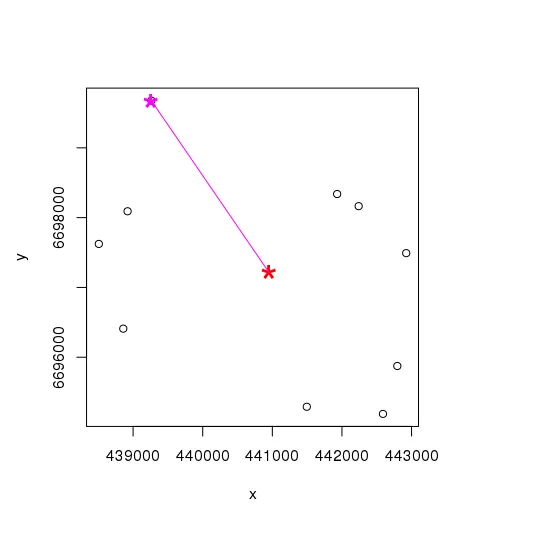
以下是我如何使用这样一个函数的可视化演示。
# easy plotting function
pointsegments <- function(z, ...) {
  segments(z[1,1], z[1,2], z[2,1], z[2,2], ...)
  points(z, pch = 16, col = c("blue", "red"))

}

plot(mydata$x, mydata$y) # points
top3 <- lapply(1:3, getBigSegment, x = mydata$x, y = mydata$y) # top3 longest lines
mycolors <- c("black","blue","green") # 3 colors
for(i in 1:3) pointsegments(top3[[i]], col = mycolors[i]) # plot lines
legend("topleft", legend = round(unlist(lapply(top3, dist))), lty = 1,
       col = mycolors, text.col = mycolors, cex = .8) # legend

enter image description here


1
这种方法首先使用 chull 来确定 extreme_points,即位于给定点的边界上的点。然后,对于每个 extreme_points,它通过排除该特定的 extreme_points 来计算 extreme_pointscentroid。然后,它从 extreme_points 中选择离 centroid 最远的点。
foo = function(X = all_points){
    plot(X)
    chull_inds = chull(X)
    extreme_points = X[chull_inds,]
    points(extreme_points, pch = 19, col = "red")
    centroid = t(sapply(1:NROW(extreme_points), function(i)
        c(mean(extreme_points[-i,1]), mean(extreme_points[-i,2]))))
    distances = sapply(1:NROW(extreme_points), function(i)
        dist(rbind(extreme_points[i,], centroid[i,])))
    points(extreme_points[which.max(distances),], pch = 18, cex = 2)
    points(X[chull_inds[which.max(distances)],], cex = 5)
    return(X[chull_inds[which.max(distances)],])
}

set.seed(42)
all_points = data.frame(x = rnorm(25), y = rnorm(25))
foo(X = all_points)
#           x         y
#18 -2.656455 0.7581632

enter image description here


网页内容由stack overflow 提供, 点击上面的
可以查看英文原文,
原文链接