如何使用matplotlib绘制具有2个特征的3D多元线性回归图?

5

我需要在matplotlib中绘制一个包含多个线性回归和2个特征的3D图。请问如何实现?

以下是我的代码:

import pandas
from sklearn import linear_model

df = pandas.read_csv("cars.csv")

X = df[['Weight', 'Volume']]
y = df['CO2']

regr = linear_model.LinearRegression()

predictedCO2 = regr.predict([scaled[0]])
print(predictedCO2)
1个回答

3

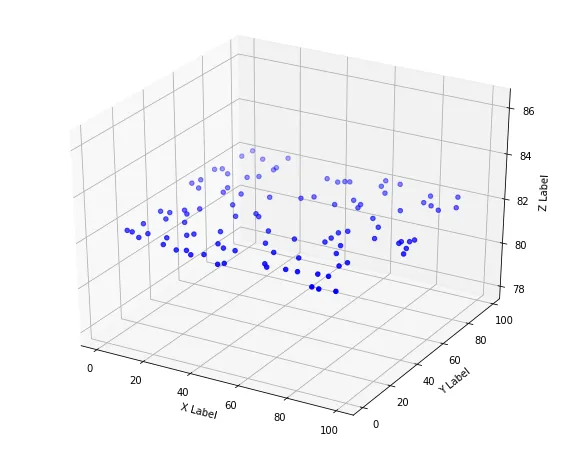
您想绘制回归模型结果的三维图。在您的三维图中,每个点都有 (x, y, z) = (重量,体积,预测的二氧化碳排放量)。

现在您可以使用以下代码进行绘制:

from mpl_toolkits.mplot3d import Axes3D
import matplotlib.pyplot as plt
import numpy as np
import random

# dummy variables for demonstration
x = [random.random()*100 for _ in range(100)]
y = [random.random()*100 for _ in range(100)]
z = [random.random()*100 or _ in range(100)]

# build the figure instance
fig = plt.figure(figsize=(10,8))
ax = fig.add_subplot(111, projection='3d')
ax.scatter(x, y, z, c='blue', marker='o')

# set your labels
ax.set_xlabel('X Label')
ax.set_ylabel('Y Label')
ax.set_zlabel('Z Label')

plt.show()

这将给您一个像这样的图表:

enter image description here


我有同样的任务。我想使用多变量方法拟合线性回归模型。我用独立变量两个(重量和柱体)和一个因变量(CO2)训练了数据。我得到了每个重量和体积点对应的预测CO2的z值。我绘制了散点图。但我的任务是在应用回归后生成通过这些点的3D空间中的拟合直线。我需要拟合一条直线,穿过这三个轴:重量、体积和预测CO2。我想绘制一个带有散点和直线的3D图。 - P_Z
线性回归模型用于拟合数据,一条直线穿过这些数据。这就是我想要实现的“绘制3D拟合直线”。 - P_Z

网页内容由stack overflow 提供, 点击上面的
可以查看英文原文,
原文链接