我在phpstorm中设置了php.ini和调试配置(Debug config)。尝试使用以下命令在phpstorm Event log中输出php脚本的调试信息:
"Error running script.php: Port 9000 is busy"
php.ini 结束:
        [XDebug]
        zend_extension="/usr/lib/php5/20090626+lfs/xdebug.so"
        xdebug.remote_enable=1
        xdebug.remote_port="9000" (the default port is 9000)
        xdebug.profiler_enable=1
        xdebug.profiler_enable_trigger = 1
        xdebug.profiler_output_dir="/etc/php5/xdebug/profiler_output_dir"
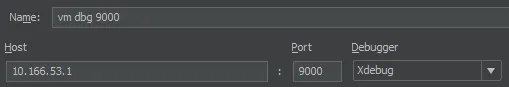
pStorm中的调试端口也设置为9000。使用 netstat -na 命令输出:
tcp 0 0 127.0.0.1:9000 0.0.0.0:* LISTEN
如果我设置到其他端口会怎样?例如将其设置为
10001似乎可以完成任务。或者只是如何使其正常工作。我不确定我是否理解xDebug的工作原理。它就像在phpstorm中运行Debug("script.php")(Shift+F9)并在文件中设置断点一样吗?有人有想法吗?
编辑:
来自:http://xdebug.org/docs/remote
xdebug.remote_port
Type: integer, Default value: 9000
The port to which Xdebug tries to connect on the remote host. Port 9000 is the default for both the client and the bundled debugclient. As many clients use this port number, it is best to leave this setting unchanged.
如果我将端口更改为9000以外的其他端口,比如超过50k的端口,会发生什么?