jQPlot 如何在 y 轴上强制设置静态最小值和最大值

9

我正在使用jqPlot来渲染条形图,并且希望做一些相当简单的事情,但我不确定该库是否有此选项。

我有这样的图表,其中y轴上可能的最大值为42。

enter image description here

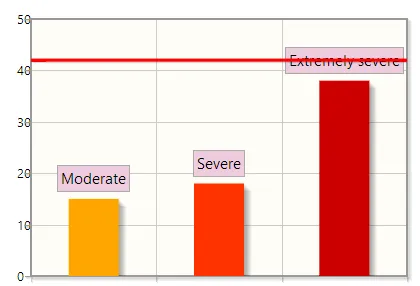
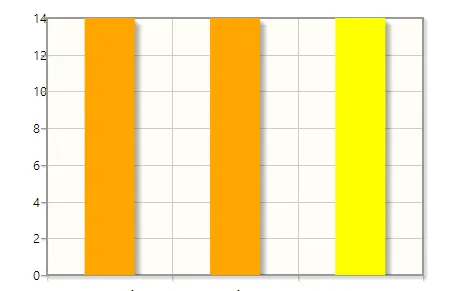
假设对于某个案例,我的任何一个柱子的最高值为14,则将呈现图表,仅显示高达14。

enter image description here

然而,我想要的是,在所有情况下,都能看到42的上限。

目前我所拥有的是:

var plot3 = $.jqplot('chart3', [line1], {
            animate: true,
            animateReplot: true, 
            seriesDefaults: {renderer: $.jqplot.BarRenderer},
            series:[{
              pointLabels:{
                  show: true,
                  labels:[depression, anxiety, stress]
              },
              rendererOptions: {
                  animation: {
                    speed: 3500
                  },
                  barWidth: 50,
                  barPadding: -15,
                  barMargin: 0,
                  varyBarColor : true,
                  highlightMouseOver: false
              }
            }],
            axes: {
              xaxis: {
                  renderer:$.jqplot.CategoryAxisRenderer
              }
            },
            canvasOverlay: {
              show: true,
              objects: [{
                  horizontalLine: {
                      y: 42,
                      lineWidth: 3,
                      color: 'rgb(255,0,0)',
                      shadow: true,
                      xOffset: 0
                  }
              }]
            }
          });
        plot3.replot( { resetAxes: true } );
1个回答

23

将此添加到您的axes:中:

       axes: {
            xaxis: {           
                renderer: $.jqplot.CategoryAxisRenderer                   
            },
            yaxis: {
                min:0,
                max:42
            }
        },

您可以添加 tickInterval 以指定在 y轴 上刻度之间的间隔。

如果您正在尝试重置轴,请将这些设置添加到您的 replot 函数中。

     plot3.replot({axes: {
                xaxis: {           
                    renderer: $.jqplot.CategoryAxisRenderer                       
                },
                yaxis: {
                    min:0,
                    max:42
                }
            }});

或者

你可以说

plot3.replot(false);

因此它不会重置您的轴。


复制了你的代码(在$.jqplot({})中的所有内容)。仍然不起作用。你使用的是哪个版本? - karancan
版本是什么?你能为你的代码创建一个JSFiddle吗?让我看看你想做什么... - Gyandeep
3
因为在“replot”操作中,您重置了坐标轴,所以它对您没有起作用......请在您的“replot”调用中指定我的代码。 - Gyandeep
我会测试一下并告诉你。 - karancan

网页内容由stack overflow 提供, 点击上面的
可以查看英文原文,
原文链接