3个回答
6
2021更新:调整了代码,适用于Python 3.8和Bokeh 2.2.3
对于那些难以调整或在bokeh网站上找不到示例的人,或者只是非常懒惰的人,下面的代码可以完成最小的工作:
from bokeh.models import ColumnDataSource, CustomJS
from bokeh.models.widgets import Button
from bokeh.io import show
import os

source = ColumnDataSource({'list1':[0,1,2,3],'list2':[4,5,6,7]})
button = Button(label="Download", button_type="success")
button.js_on_click(CustomJS(args=dict(source=source),code=open(os.path.join(os.path.dirname(__file__),"download.js")).read()))
show(button)
文件下载.js:
function table_to_csv(source) {
    const columns = Object.keys(source.data)
    const nrows = source.get_length()
    const lines = [columns.join(',')]

    for (let i = 0; i < nrows; i++) {
        let row = [];
        for (let j = 0; j < columns.length; j++) {
            const column = columns[j]
            row.push(source.data[column][i].toString())
        }
        lines.push(row.join(','))
    }
    return lines.join('\n').concat('\n')
}


const filename = 'data_result.csv'
const filetext = table_to_csv(source)
const blob = new Blob([filetext], { type: 'text/csv;charset=utf-8;' })

//addresses IE
if (navigator.msSaveBlob) {
    navigator.msSaveBlob(blob, filename)
} else {
    const link = document.createElement('a')
    link.href = URL.createObjectURL(blob)
    link.download = filename
    link.target = '_blank'
    link.style.visibility = 'hidden'
    link.dispatchEvent(new MouseEvent('click'))
}
- Joris
3
1
与我对这个stackoverflow问题的回应相关。下面是复制的回应:
以下是Python 3.7.5和Bokeh 1.4.0的工作示例
此jupyter笔记本的公共github链接:
https://github.com/surfaceowl-ai/python_visualizations/blob/master/notebooks/bokeh_save_linked_plot_data.ipynb
环境报告:
虚拟环境python版本: Python 3.7.5
虚拟环境ipython版本: 7.9.0
watermark软件包报告:
bokeh 1.4.0
jupyter 1.0.0
numpy 1.17.4
pandas 0.25.3
rise 5.6.0
watermark 2.0.2
# Generate linked plots + TABLE displaying data + save button to export cvs of selected data
from random import random
from bokeh.io import output_notebook # prevent opening separate tab with graph
from bokeh.io import show
from bokeh.layouts import row
from bokeh.layouts import grid
from bokeh.models import CustomJS, ColumnDataSource
from bokeh.models import Button # for saving data
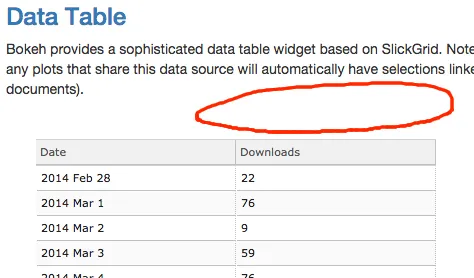
from bokeh.models.widgets import DataTable, DateFormatter, TableColumn
from bokeh.models import HoverTool
from bokeh.plotting import figure
# create data
x = [random() for x in range(500)]
y = [random() for y in range(500)]
# create first subplot
plot_width = 400
plot_height = 400
s1 = ColumnDataSource(data=dict(x=x, y=y))
fig01 = figure(
plot_width=plot_width,
plot_height=plot_height,
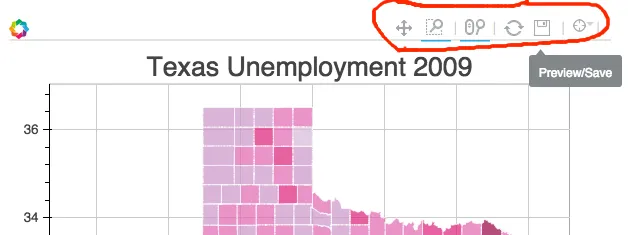
tools=["lasso_select", "reset", "save"],
title="Select Here",
)
fig01.circle("x", "y", source=s1, alpha=0.6)
# create second subplot
s2 = ColumnDataSource(data=dict(x=[], y=[]))
# demo smart error msg: `box_zoom`, vs `BoxZoomTool`
fig02 = figure(
plot_width=400,
plot_height=400,
x_range=(0, 1),
y_range=(0, 1),
tools=["box_zoom", "wheel_zoom", "reset", "save"],
title="Watch Here",
)
fig02.circle("x", "y", source=s2, alpha=0.6, color="firebrick")
# create dynamic table of selected points
columns = [
TableColumn(field="x", title="X axis"),
TableColumn(field="y", title="Y axis"),
]
table = DataTable(
source=s2,
columns=columns,
width=400,
height=600,
sortable=True,
selectable=True,
editable=True,
)
# fancy javascript to link subplots
# js pushes selected points into ColumnDataSource of 2nd plot
# inspiration for this from a few sources:
# credit: https://stackoverflow.com/users/1097752/iolsmit via: https://stackoverflow.com/questions/48982260/bokeh-lasso-select-to-table-update
# credit: https://stackoverflow.com/users/8412027/joris via: https://dev59.com/SFsX5IYBdhLWcg3wJcyW
s1.selected.js_on_change(
"indices",
CustomJS(
args=dict(s1=s1, s2=s2, table=table),
code="""
var inds = cb_obj.indices;
var d1 = s1.data;
var d2 = s2.data;
d2['x'] = []
d2['y'] = []
for (var i = 0; i < inds.length; i++) {
d2['x'].push(d1['x'][inds[i]])
d2['y'].push(d1['y'][inds[i]])
}
s2.change.emit();
table.change.emit();
var inds = source_data.selected.indices;
var data = source_data.data;
var out = "x, y\\n";
for (i = 0; i < inds.length; i++) {
out += data['x'][inds[i]] + "," + data['y'][inds[i]] + "\\n";
}
var file = new Blob([out], {type: 'text/plain'});
""",
),
)
# create save button - saves selected datapoints to text file onbutton
# inspriation for this code:
# credit: https://dev59.com/QVwZ5IYBdhLWcg3wINPQ
# note: savebutton line `var out = "x, y\\n";` defines the header of the exported file, helpful to have a header for downstream processing
savebutton = Button(label="Save", button_type="success")
savebutton.callback = CustomJS(
args=dict(source_data=s1),
code="""
var inds = source_data.selected.indices;
var data = source_data.data;
var out = "x, y\\n";
for (i = 0; i < inds.length; i++) {
out += data['x'][inds[i]] + "," + data['y'][inds[i]] + "\\n";
}
var file = new Blob([out], {type: 'text/plain'});
var elem = window.document.createElement('a');
elem.href = window.URL.createObjectURL(file);
elem.download = 'selected-data.txt';
document.body.appendChild(elem);
elem.click();
document.body.removeChild(elem);
""",
)
# add Hover tool
# define what is displayed in the tooltip
tooltips = [
("X:", "@x"),
("Y:", "@y"),
("static text", "static text"),
]
fig02.add_tools(HoverTool(tooltips=tooltips))
# display results
# demo linked plots
# demo zooms and reset
# demo hover tool
# demo table
# demo save selected results to file
layout = grid([fig01, fig02, table, savebutton], ncols=3)
output_notebook()
show(layout)
# things to try:
# select random shape of blue dots with lasso tool in 'Select Here' graph
# only selected points appear as red dots in 'Watch Here' graph -- try zooming, saving that graph separately
# selected points also appear in the table, which is sortable
# click the 'Save' button to export a csv
# TODO: export from Bokeh to pandas dataframe
- surfaceowl
网页内容由stack overflow 提供, 点击上面的可以查看英文原文,
原文链接
原文链接
- 相关问题
- 3 有没有一种交互式的方法可以关闭 Python `Bokeh` 图表中的图例?
- 3 有没有一种方法可以遍历列表并返回以其内容命名的变量?
- 3 有没有一种方法可以在Python中保存直方图的箱子?
- 3 有没有一种JavaScript数据表组件可以将列显示为行?
- 7 Pycharm:有没有一种方法可以保存断点状态并继续调试?
- 3 有没有一种方法可以备份app-engine blobstore中的所有内容?
- 4 有没有一种方法可以描述/类型提示函数参数的内容?
- 5 有没有一种方法可以取消gevent.spawn_later()?
- 4 有没有一种方法可以在Python字典中保存重复的键?
- 25 SQLAlchemy - 有没有一种方法可以查看当前会话中的内容?
Object.keys检索到的列的顺序与表格中的顺序不同,而是按照字母顺序检索。当使用source.data时,Python不存在此问题。 - Pablo