我想在表格标签中添加数学表达式(例如: 2^3 应该被正确格式化)
这里是一个简单的表格示例: http://thomas-cokelaer.info/blog/2012/10/pyqt4-example-of-tablewidget-usage/
setHorizontalHeaderLabels只接受字符串。 我想知道是否可能以某种方式实现此 matplotlib 方法: matplotlib - write TeX on Qt form
还有其他选项吗?
我想在表格标签中添加数学表达式(例如: 2^3 应该被正确格式化)
这里是一个简单的表格示例: http://thomas-cokelaer.info/blog/2012/10/pyqt4-example-of-tablewidget-usage/
setHorizontalHeaderLabels只接受字符串。 我想知道是否可能以某种方式实现此 matplotlib 方法: matplotlib - write TeX on Qt form
还有其他选项吗?
我一直在尝试在QTableWidget的表头中显示复杂标签。我通过重新实现QHeaderView的paintSection方法,并使用QTextDocument手动绘制标签,如Qt Centre上的一个帖子所述。
然而,与LaTex相比,这种解决方案有些局限性。我觉得你在你的OP中提出的方法可能是个好主意,即使用matplotlib在PySide中渲染LaTex。
在这种方法中需要的第一件事情是能够将matplotlib图形转换为可以轻松绘制在任何QWidget上的格式。下面是一个函数,它以mathTex表达式作为输入,并通过matplotlib将其转换为一个QPixmap。
import sys
import matplotlib as mpl
from matplotlib.backends.backend_agg import FigureCanvasAgg
from PySide import QtGui, QtCore

def mathTex_to_QPixmap(mathTex, fs):

    #---- set up a mpl figure instance ----

    fig = mpl.figure.Figure()
    fig.patch.set_facecolor('none')
    fig.set_canvas(FigureCanvasAgg(fig))
    renderer = fig.canvas.get_renderer()

    #---- plot the mathTex expression ----

    ax = fig.add_axes([0, 0, 1, 1])
    ax.axis('off')
    ax.patch.set_facecolor('none')
    t = ax.text(0, 0, mathTex, ha='left', va='bottom', fontsize=fs)

    #---- fit figure size to text artist ----

    fwidth, fheight = fig.get_size_inches()
    fig_bbox = fig.get_window_extent(renderer)

    text_bbox = t.get_window_extent(renderer)

    tight_fwidth = text_bbox.width * fwidth / fig_bbox.width
    tight_fheight = text_bbox.height * fheight / fig_bbox.height

    fig.set_size_inches(tight_fwidth, tight_fheight)

    #---- convert mpl figure to QPixmap ----

    buf, size = fig.canvas.print_to_buffer()
    qimage = QtGui.QImage.rgbSwapped(QtGui.QImage(buf, size[0], size[1],
                                                  QtGui.QImage.Format_ARGB32))
    qpixmap = QtGui.QPixmap(qimage)

    return qpixmap
下一步是在 QTableWidget 的标题中绘制 QPixmap。如下所示,我通过子类化 QTableWidget 并重新实现 setHorizontalHeaderLabels 方法来完成,该方法用于将标签的 mathTex 表达式转换为 QPixmap,并将其作为列表传递给 QHeaderView 的子类。然后,在 QHeaderView 的 paintSection 方法的重新实现中绘制 QPixmap,并在 sizeHint 方法的重新实现中设置标题的高度以适应 mathTex 表达式的高度。
class MyQTableWidget(QtGui.QTableWidget):
    def __init__(self, parent=None):
        super(MyQTableWidget, self).__init__(parent)

        self.setHorizontalHeader(MyHorizHeader(self))

    def setHorizontalHeaderLabels(self, headerLabels, fontsize):

        qpixmaps = []
        indx = 0
        for labels in headerLabels:
            qpixmaps.append(mathTex_to_QPixmap(labels, fontsize))
            self.setColumnWidth(indx, qpixmaps[indx].size().width() + 16)
            indx += 1

        self.horizontalHeader().qpixmaps = qpixmaps

        super(MyQTableWidget, self).setHorizontalHeaderLabels(headerLabels)


class MyHorizHeader(QtGui.QHeaderView):
    def __init__(self, parent):
        super(MyHorizHeader, self).__init__(QtCore.Qt.Horizontal, parent)

        self.setClickable(True)
        self.setStretchLastSection(True)

        self.qpixmaps = []

    def paintSection(self, painter, rect, logicalIndex):

        if not rect.isValid():
            return

        #------------------------------ paint section (without the label) ----

        opt = QtGui.QStyleOptionHeader()
        self.initStyleOption(opt)

        opt.rect = rect
        opt.section = logicalIndex
        opt.text = ""

        #---- mouse over highlight ----

        mouse_pos = self.mapFromGlobal(QtGui.QCursor.pos())
        if rect.contains(mouse_pos):
            opt.state |= QtGui.QStyle.State_MouseOver

        #---- paint ----

        painter.save()
        self.style().drawControl(QtGui.QStyle.CE_Header, opt, painter, self)
        painter.restore()

        #------------------------------------------- paint mathText label ----

        qpixmap = self.qpixmaps[logicalIndex]

        #---- centering ----

        xpix = (rect.width() - qpixmap.size().width()) / 2. + rect.x()
        ypix = (rect.height() - qpixmap.size().height()) / 2.

        #---- paint ----

        rect = QtCore.QRect(xpix, ypix, qpixmap.size().width(),
                            qpixmap.size().height())
        painter.drawPixmap(rect, qpixmap)

    def sizeHint(self):

        baseSize = QtGui.QHeaderView.sizeHint(self)

        baseHeight = baseSize.height()
        if len(self.qpixmaps):
            for pixmap in self.qpixmaps:
               baseHeight = max(pixmap.height() + 8, baseHeight)
        baseSize.setHeight(baseHeight)

        self.parentWidget().repaint()

        return baseSize
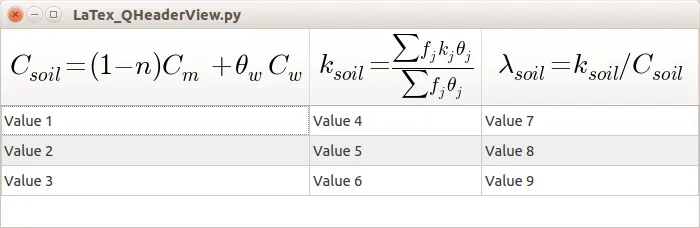
以下是上述内容的一个简单应用示例。
if __name__ == '__main__':

    app = QtGui.QApplication(sys.argv)

    w = MyQTableWidget()
    w.verticalHeader().hide()

    headerLabels = [
        '$C_{soil}=(1 - n) C_m + \\theta_w C_w$',
        '$k_{soil}=\\frac{\\sum f_j k_j \\theta_j}{\\sum f_j \\theta_j}$',
        '$\\lambda_{soil}=k_{soil} / C_{soil}$']

    w.setColumnCount(len(headerLabels))
    w.setHorizontalHeaderLabels(headerLabels, 25)
    w.setRowCount(3)
    w.setAlternatingRowColors(True)

    k = 1
    for j in range(3):
        for i in range(3):
            w.setItem(i, j, QtGui.QTableWidgetItem('Value %i' % (k)))
            k += 1

    w.show()
    w.resize(700, 200)

    sys.exit(app.exec_())