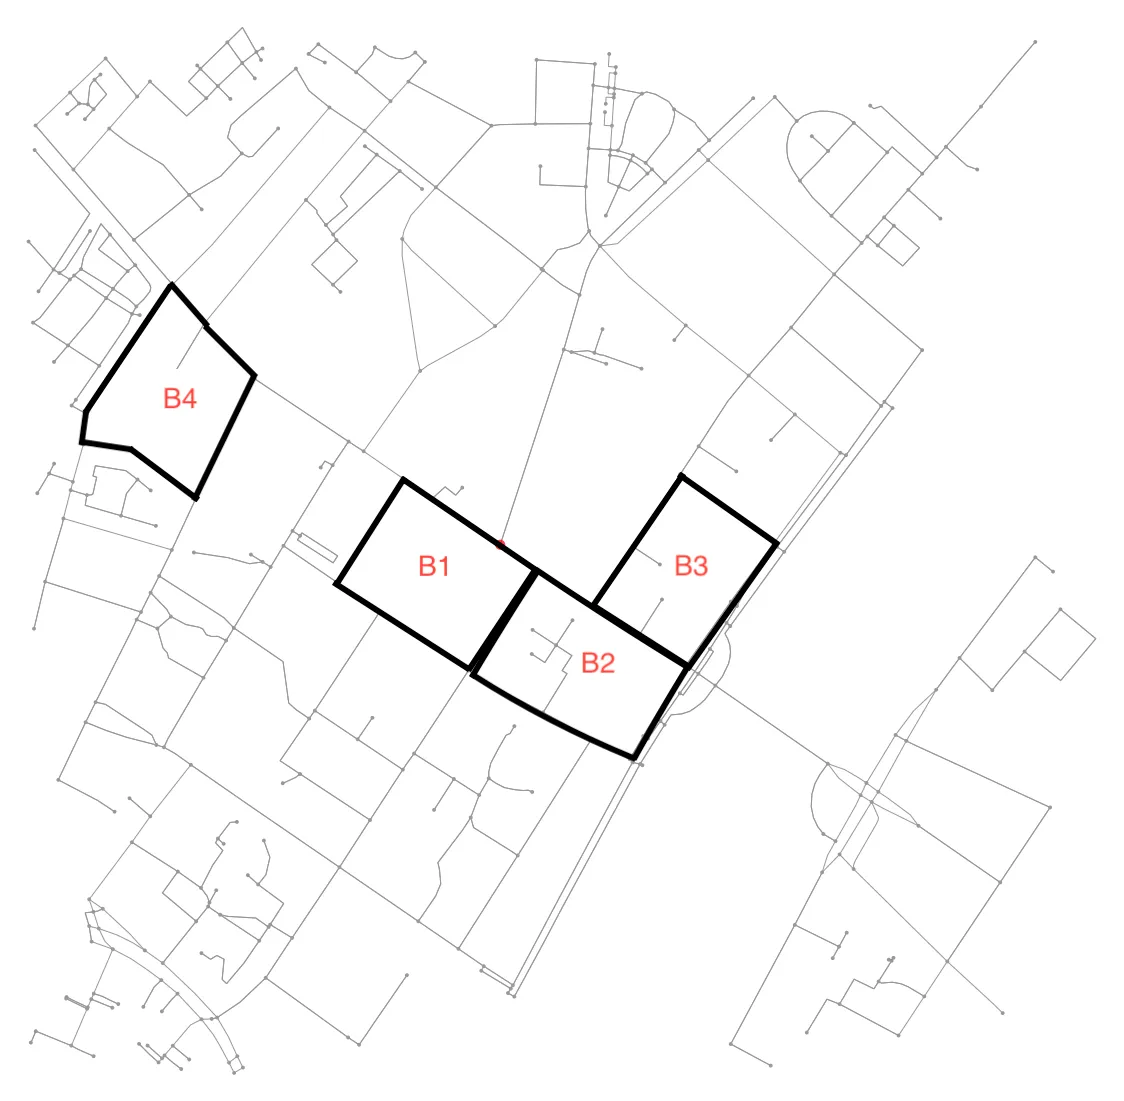
使用图形查找城市街区令人惊讶地不容易。基本上,这相当于查找最小环的最小集合(SSSR),这是一个NP完全问题。可以在
此处找到有关此问题(及相关问题)的评论。在SO上,有一种算法描述来解决它
此处。据我所知,
networkx中没有相应的实现(或者说在Python中没有)。我尝试了这种方法,但很快就放弃了 - 我今天的大脑无法胜任那种工作。话虽如此,
我会授予任何在以后访问此页面并发布在Python中找到SSSR算法的测试实现的人赏金。
相反,我采用了不同的方法,利用了保证图形是平面的事实。简而言之,我们将其视为图像分割问题,而不是图形问题。首先,我们找到图像中的所有连接区域。然后,我们确定每个区域周围的轮廓,将轮廓在图像坐标中转换回经度和纬度。
考虑到以下导入和函数定义:
"""
Find house blocks in osmnx graphs.
"""
import numpy as np
import osmnx as ox
import networkx as nx
import matplotlib.pyplot as plt
from matplotlib.path import Path
from matplotlib.patches import PathPatch
from matplotlib.backends.backend_agg import FigureCanvasAgg as FigureCanvas
from skimage.measure import label, find_contours, points_in_poly
from skimage.color import label2rgb
ox.config(log_console=True, use_cache=True)
def k_core(G, k):
H = nx.Graph(G, as_view=True)
H.remove_edges_from(nx.selfloop_edges(H))
core_nodes = nx.k_core(H, k)
H = H.subgraph(core_nodes)
return G.subgraph(core_nodes)
def plot2img(fig):
fig.subplots_adjust(left=0, bottom=0, right=1, top=1, wspace=0, hspace=0)
canvas = FigureCanvas(fig)
canvas.draw()
img_as_string, (width, height) = canvas.print_to_buffer()
as_rgba = np.fromstring(img_as_string, dtype='uint8').reshape((height, width, 4))
return as_rgba[:,:,:3]
加载数据。如果需要反复测试,请缓存导入文件,否则您的账户可能会被封禁。从我的经验来看。
G = ox.graph_from_address('Nørrebrogade 20, Copenhagen Municipality',
network_type='all', distance=500)
G_projected = ox.project_graph(G)
ox.save_graphml(G_projected, filename='network.graphml')
修剪无法成为循环的节点和边。
此步骤并非必需,但会产生更漂亮的轮廓。
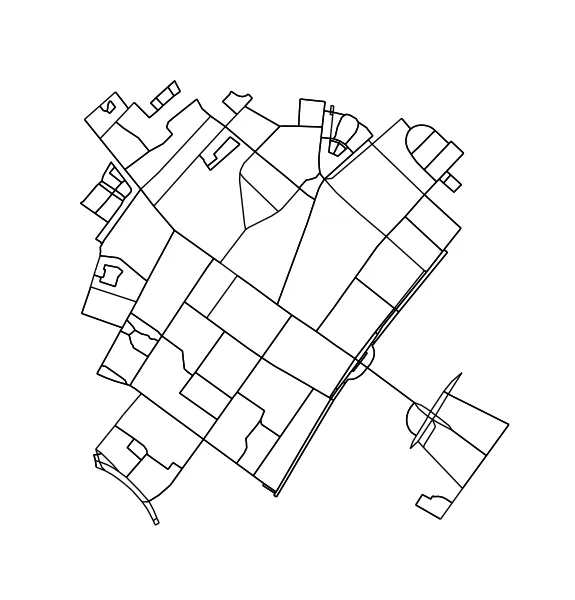
H = k_core(G, 2)
fig1, ax1 = ox.plot_graph(H, node_size=0, edge_color='k', edge_linewidth=1)
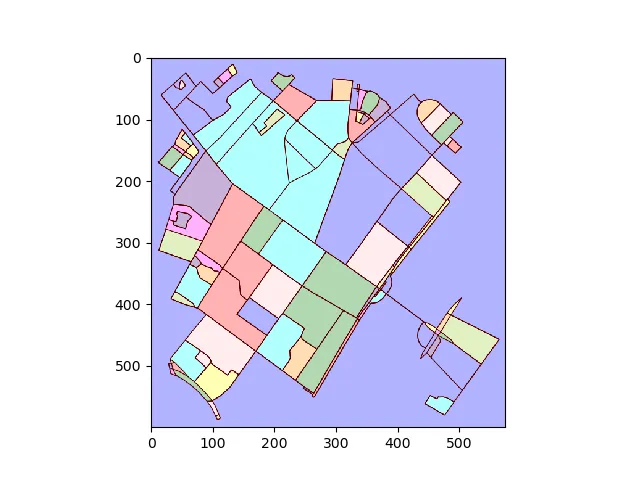
将绘图转换为图像并查找连接区域:
img = plot2img(fig1)
label_image = label(img > 128)
image_label_overlay = label2rgb(label_image[:,:,0], image=img[:,:,0])
fig, ax = plt.subplots(1,1)
ax.imshow(image_label_overlay)
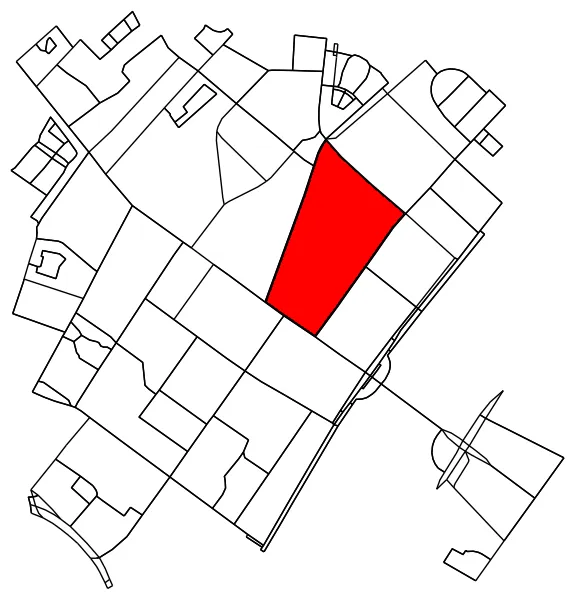
对于每个标记区域,找到轮廓并将轮廓像素坐标转换回数据坐标。
ii = np.argsort(np.bincount(label_image.ravel()))[-5]
mask = (label_image[:,:,0] == ii)
contours = find_contours(mask.astype(np.float), 0.5)
contour = sorted(contours, key=lambda x: len(x))[-1]
fig2, ax2 = plt.subplots()
ax2.imshow(mask, interpolation='nearest', cmap='gray')
ax2.autoscale(enable=False)
ax2.step(contour.T[1], contour.T[0], linewidth=2, c='r')
plt.close(fig2)
contour = np.fliplr(contour)
pixel_to_data = ax2.transData + ax2.transAxes.inverted() + ax1.transAxes + ax1.transData.inverted()
transformed_contour = pixel_to_data.transform(contour)
transformed_contour_path = Path(transformed_contour, closed=True)
patch = PathPatch(transformed_contour_path, facecolor='red')
ax1.add_patch(patch)
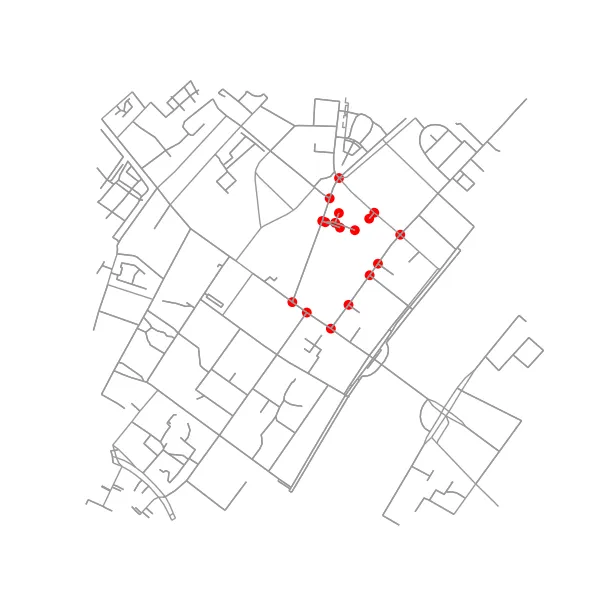
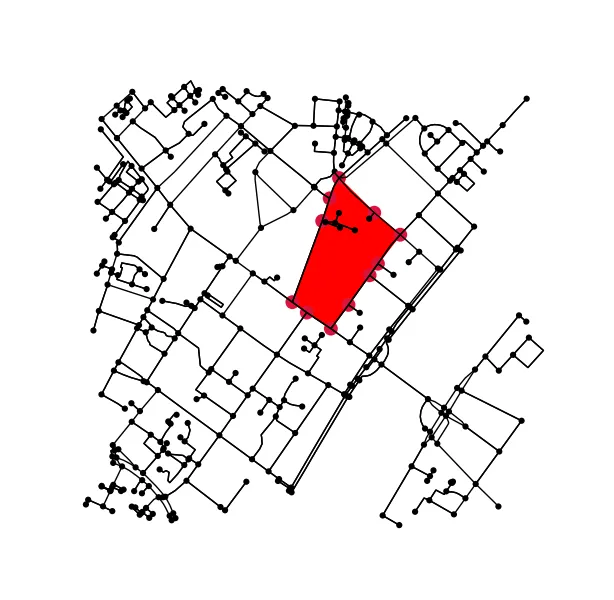
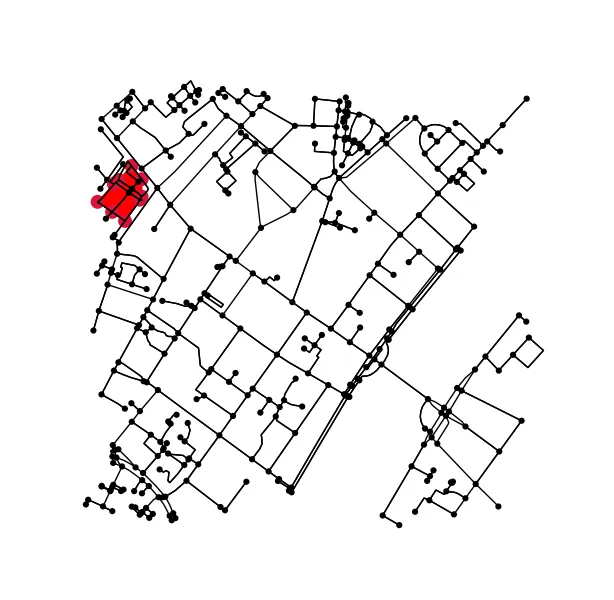
确定原始图中所有在轮廓线内(或者在轮廓线上)的点。
x = G.nodes.data('x')
y = G.nodes.data('y')
xy = np.array([(x[node], y[node]) for node in G.nodes])
eps = (xy.max(axis=0) - xy.min(axis=0)).mean() / 100
is_inside = transformed_contour_path.contains_points(xy, radius=-eps)
nodes_inside_block = [node for node, flag in zip(G.nodes, is_inside) if flag]

node_size = [50 if node in nodes_inside_block else 0 for node in G.nodes]
node_color = ['r' if node in nodes_inside_block else 'k' for node in G.nodes]
fig3, ax3 = ox.plot_graph(G, node_color=node_color, node_size=node_size)
确定两个块是否为相邻块非常简单。只需检查它们是否共享一个节点即可:
if set(nodes_inside_block_1) & set(nodes_inside_block_2): # empty set evaluates to False
    print("Blocks are neighbors.")