如何在shiny r中将多个图形并排放置?

38

在mainpanel中,我尝试通过fluidrow来解决这个问题。然而,我的其中一个图表是可选的,用户可以选择是否显示。当用户点击按钮时,第二个图表会出现在第一个图表下面。

   fluidRow(
      column(2, align="right",
             plotOutput(outputId = "plotgraph1", width  = "500px",height = "400px"),  
             plotOutput(outputId = "plotgraph2", width  = "500px",height = "400px")
      ))

我尝试使用"align"和"widths"属性,但没有任何变化。

3个回答

59
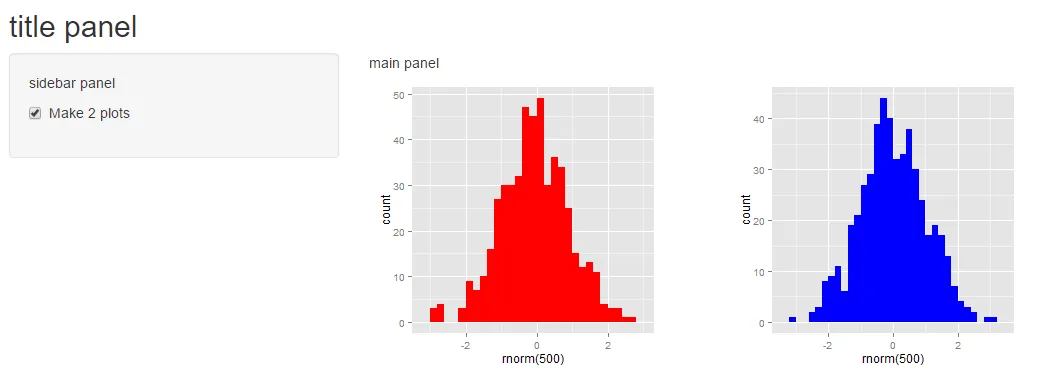
使用 @Mike Wise 的例子,你也可以使用 splitLayout(cellWidths = c("50%", "50%")... 把两个图并排显示。 ui..R
library(shiny)

shinyUI(fluidPage(
  titlePanel("title panel"),

  sidebarLayout(position = "left",
                sidebarPanel("sidebar panel",
                             checkboxInput("do2", "Make 2 plots", value = T)
                ),
                mainPanel("main panel",
                          fluidRow(
                            splitLayout(cellWidths = c("50%", "50%"), plotOutput("plotgraph1"), plotOutput("plotgraph2"))
                          )
                )
  )
)
)

server.R

shinyServer(function(input, output) 
{
  set.seed(1234)
  pt1 <- qplot(rnorm(500),fill=I("red"),binwidth=0.2,title="plotgraph1")
  pt2 <- reactive({
    input$do2
    if (input$do2){
      return(qplot(rnorm(500),fill=I("blue"),binwidth=0.2,title="plotgraph2"))
    } else {
      return(NULL)
    }
  })
  output$plotgraph1 = renderPlot({pt1})
  output$plotgraph2 = renderPlot({pt2()})
}
)

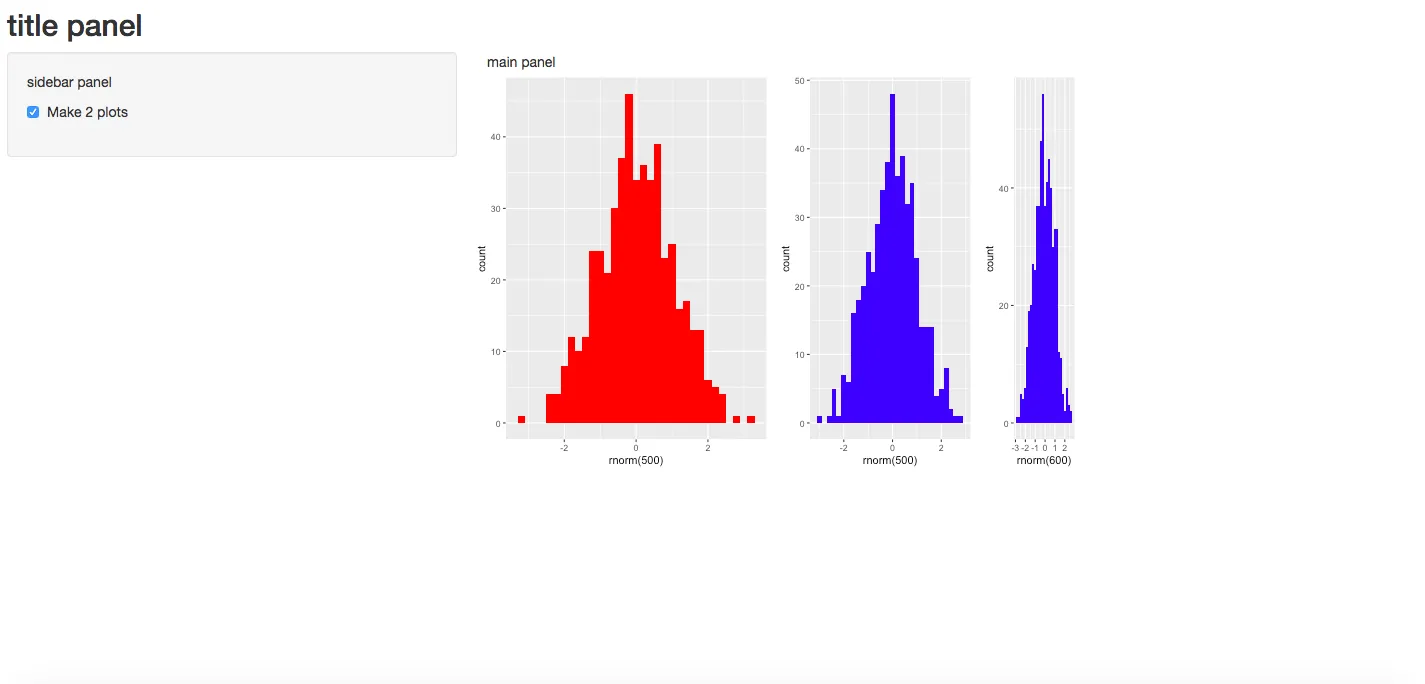
您还可以根据下图中显示的数字进行调整,比例为c("60%", "40%")。

enter image description here

编辑:@Mike Wise的新答案确实给了一些灵活性。但是splitLayout也可以用于超过两个图。使用cellWidths可以更改每个单独图的大小。并且verticalLayout()也可以用于垂直添加图(请参见评论部分)。

library(shiny)
library(ggplot2)
u<- shinyUI(fluidPage(
  titlePanel("title panel"),

  sidebarLayout(position = "left",
                sidebarPanel("sidebar panel",
                             checkboxInput("do2", "Make 2 plots", value = T)
                ),
                mainPanel("main panel",
                          fluidRow(
                            splitLayout(style = "border: 1px solid silver:", cellWidths = c(300,200,100), 
                            plotOutput("plotgraph1"), 
                            plotOutput("plotgraph2"),
                            plotOutput("plotgraph3")
                            )
                          )
                )
  )
)
)
s <- shinyServer(function(input, output){
  set.seed(1234)
  pt1 <- qplot(rnorm(500),fill=I("red"),binwidth=0.2,title="plotgraph1")
  pt3 <- qplot(rnorm(600),fill=I("blue"),binwidth=0.2,title="plotgraph3")
  pt2 <- reactive({
    input$do2
    if (input$do2){
      return(qplot(rnorm(500),fill=I("blue"),binwidth=0.2,title="plotgraph2"))
    } else {
      return(NULL)
    }
  })
  output$plotgraph1 = renderPlot({pt1})
  output$plotgraph2 = renderPlot({pt2()})
  output$plotgraph3 = renderPlot({pt3}
  )
})

shinyApp(u,s)

enter image description here


不错哦,给你点赞 :) - Mike Wise
他本该也给我点个赞。你也一样。 - Mike Wise
能否将其分成4个相等的部分,并拥有一个2乘2的矩阵,其中包含4个图形? - Liza
4
@liza,实际上是可以的。你只需要使用fluidRow()函数和verticalLayout()函数,然后在其中使用splitLayout()函数来设置页面布局,再用plotOutput()函数添加需要展示的图形即可。其中cellWidths参数可以用来设置每个单元格的宽度比例。 - MLavoie
非常适合我的使用情况,可以将DataTable和绘图并排放置在一起,而grid.arrange()无法实现。谢谢! - clesiemo3

38
几年过去了,尽管其他答案 - 包括我的 - 仍然有效,但这不是我今天推荐的方法。今天我会使用 gridExtra 包中的 grid.arrange 来布局。
  • 它允许任意数量的绘图,并可以以网格状排列它们。(我曾错误地认为 splitLayout 只适用于两个图表)。
  • 它有更多的自定义选项(你可以指定行、列、标题、页脚、填充等)
  • 即使对于两个图表,它也更容易使用,因为在 UI 中进行布局很棘手 - 当屏幕大小改变时,很难预测 Bootstrap 会如何处理你的元素。
  • 由于这个问题引起了很多流量,我觉得应该提供更多的选择。
cowplot 包也值得一试,它提供类似的功能,但我对它不是很熟悉。
下面是一个小的闪亮程序,演示了这一点:
library(shiny)
library(ggplot2)
library(gridExtra)

u <- shinyUI(fluidPage(
  titlePanel("title panel"),
  sidebarLayout(position = "left",
      sidebarPanel("sidebar panel",
           checkboxInput("donum1", "Make #1 plot", value = T),
           checkboxInput("donum2", "Make #2 plot", value = F),
           checkboxInput("donum3", "Make #3 plot", value = F),
           sliderInput("wt1","Weight 1",min=1,max=10,value=1),
           sliderInput("wt2","Weight 2",min=1,max=10,value=1),
           sliderInput("wt3","Weight 3",min=1,max=10,value=1)
      ),
      mainPanel("main panel",
          column(6,plotOutput(outputId="plotgraph", width="500px",height="400px"))
))))

s <- shinyServer(function(input, output) 
{
  set.seed(123)
  pt1 <- reactive({
    if (!input$donum1) return(NULL)
    qplot(rnorm(500),fill=I("red"),binwidth=0.2,main="plotgraph1")
    })
  pt2 <- reactive({
    if (!input$donum2) return(NULL)
    qplot(rnorm(500),fill=I("blue"),binwidth=0.2,main="plotgraph2")
  })
  pt3 <- reactive({
    if (!input$donum3) return(NULL)
    qplot(rnorm(500),fill=I("green"),binwidth=0.2,main="plotgraph3")
  })
  output$plotgraph = renderPlot({
    ptlist <- list(pt1(),pt2(),pt3())
    wtlist <- c(input$wt1,input$wt2,input$wt3)
    # remove the null plots from ptlist and wtlist
    to_delete <- !sapply(ptlist,is.null)
    ptlist <- ptlist[to_delete] 
    wtlist <- wtlist[to_delete]
    if (length(ptlist)==0) return(NULL)

    grid.arrange(grobs=ptlist,widths=wtlist,ncol=length(ptlist))
  })
})
shinyApp(u,s)

Yielding(产出):

enter image description here


grid.arrange在主面板中的五个图表中,是否可以与renderPlotly一起使用来处理其中两个图表? - Ed_Gravy

9

很抱歉,您并没有给我们一个完整的例子,但我认为这是您想要的:

ui.r

# ui.R

shinyUI(fluidPage(
  titlePanel("title panel"),

  sidebarLayout(position = "left",
    sidebarPanel("sidebar panel",
      checkboxInput("do2", "Make 2 plots", value = T)
      ),
      mainPanel("main panel",
        fluidRow(
          column(6,plotOutput(outputId="plotgraph1", width="300px",height="300px")),  
          column(6,plotOutput(outputId="plotgraph2", width="300px",height="300px"))
        )
      )
    )
  )
)

server.r

# server.r

library(ggplot2)

shinyServer(function(input, output) 
  {
  set.seed(1234)
  pt1 <- qplot(rnorm(500),fill=I("red"),binwidth=0.2,title="plotgraph1")
    pt2 <- reactive({
      input$do2
      if (input$do2){
        return(qplot(rnorm(500),fill=I("blue"),binwidth=0.2,title="plotgraph2"))
      } else {
        return(NULL)
      }
    })
    output$plotgraph1 = renderPlot({pt1})
    output$plotgraph2 = renderPlot({pt2()})
  }
)

输出

“制作2个图表”已选中:

这里输入图片描述

“制作2个图表”未选中:

这里输入图片描述


网页内容由stack overflow 提供, 点击上面的
可以查看英文原文,
原文链接