使用Mathematica对离散数据进行连续傅里叶变换?

4

我有一些周期性的数据,但是数据量不是周期的倍数。如何对这些数据进行傅里叶分析?例如:

% 让我们创建一些用于测试的数据:

data = Table[N[753+919*Sin[x/623-125]], {x,1,25000}] 

我现在收到了这些数据,但不知道它来自上述公式。我正在尝试从“数据”中重构公式。

观察傅里叶级数的前几个非常数项:

ListPlot[Table[Abs[Fourier[data]][[x]], {x,2,20}], PlotJoined->True, 
 PlotRange->All] 

Mathematica图形

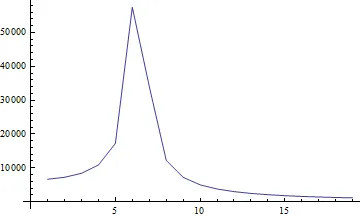
上图显示了一个在6处的预期峰值(因为周期数实际上是25000/(623*2*Pi)或约为6.38663,尽管我们不知道这个数值)。

% 现在,如何得到回6.38663?一种方法是使用任意倍数的Cos[x]“卷积”数据。

convolve[n_] := Sum[data[[x]]*Cos[n*x], {x,1,25000}] 

% 并在n=6附近绘制“卷积”图形:

Plot[convolve[n],{n,5,7}, PlotRange->All] 
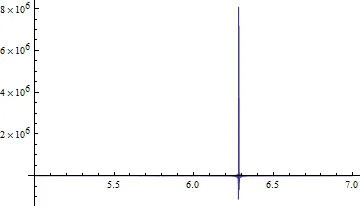
Mathematica图形

我们可以在预期范围内看到一个峰值。

% 我们尝试使用FindMaximum:

FindMaximum[convolve[n],{n,5,7}] 

但结果无用且不准确:
FindMaximum::fmmp:  
   Machine precision is insufficient to achieve the requested accuracy or 
    precision. 

Out[119]= {98.9285, {n -> 5.17881}} 

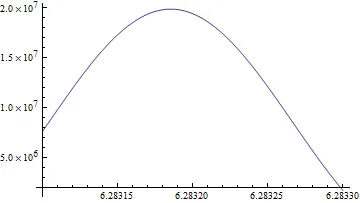
由于该函数非常波动,我们需要通过对绘图进行视觉分析来细化我们的区间,最终找到一个convolve[]不会过于波动的区间:

Plot[convolve[n],{n,6.2831,6.2833}, PlotRange->All] 

Mathematica图形

FindMaximum是如何工作的:

FindMaximum[convolve[n],{n,6.2831,6.2833}] // FortranForm 
List(1.984759605826571e7,List(Rule(n,6.2831853071787975))) 

% 但是,这个过程很丑陋,需要人为干预,而且计算convolve[]非常慢。有没有更好的方法来解决这个问题?

% 查看数据的傅里叶级数,我能否推断出“真实”的周期数是6.38663?当然,实际结果应该是6.283185,因为我的数据更符合这个值(因为我只在有限数量的点上采样)。

3个回答

3

使用自相关来查找周期长度并得出估计值:

autocorrelate[data_, d_] := 
 Plus @@ (Drop[data, d]*Drop[data, -d])/(Length[data] - d)

ListPlot[Table[{d, autocorrelate[data, d]}, {d, 0, 5000, 100}]]

Mathematica图形

从d=0开始智能搜索第一个最大值可能是您可以从可用数据中获得的最佳估计?


我意识到这并没有解决标题中提出的问题,但它确实涉及到在样本中找到周期数。 - SEngstrom
这很有趣,我正在研究它。我试图弄清楚自相关是什么以及它的工作原理,是否有帮助,以及答案的含义。你把一个非常抖动的函数变成了一个平滑的函数,这很好。 - user354134
自相关是将函数与其自身进行相关性分析 - 适用于在不知道周期时找到重复模式。它也可以通过傅里叶变换高效地实现。 - SEngstrom
也许你可以比我更好地帮助这个用户:http://stackoverflow.com/questions/4466255/how-to-calculate-correlation-between-time-periods - Dr. belisarius
你也可以使用 ListCorrelate 来提高效率。 - Szabolcs

3

基于Mathematica的傅里叶函数/应用/频率识别帮助文档:
在版本7上进行了检查。

n = 25000;
data = Table[N[753 + 919*Sin[x/623 - 125]], {x, 1, n}];
pdata = data - Total[data]/Length[data];
f = Abs[Fourier[pdata]];
pos = Ordering[-f, 1][[1]]; (*the position of the first Maximal value*)  
fr = Abs[Fourier[pdata Exp[2 Pi I (pos - 2) N[Range[0, n - 1]]/n], 
   FourierParameters -> {0, 2/n}]];
frpos = Ordering[-fr, 1][[1]];

N[(pos - 2 + 2 (frpos - 1)/n)]

返回6.37072


太棒了!我按照“pos”中的步骤(规范化数据并找到最大的傅里叶系数[由于规范化,常数项为0])进行了操作,但是“fr=”这一行代码是如何实现的呢?这似乎是我正在寻找的关键。 - user354134
1
它再次对pdata*e^i(...)进行傅里叶变换,并利用傅里叶变换的性质来计算校正/执行魔法。 - tsvikas

0

(* the data *) 

data = Table[N[753+919*Sin[x/623-125]], {x,1,25000}]; 

(* Find the position of the largest Fourier coefficient, after 
removing the last half of the list (which is redundant) and the 
constant term; the [[1]] is necessary because Ordering returns a list *) 

f2 = Ordering[Abs[Take[Fourier[data], {2,Round[Length[data]/2+1]}]],-1][[1]] 

(* Result: 6 *) 

(* Directly find the least squares difference between all functions of 
the form a+b*Sin[c*n-d], with intelligent starting values *) 

sol = FindMinimum[Sum[((a+b*Sin[c*n-d]) - data[[n]])^2, {n,1,Length[data]}], 
{{a,Mean[data]},{b,(Max[data]-Min[data])/2},{c,2*f2*Pi/Length[data]},d}] 

(* Result (using //InputForm):  

FindMinimum::sszero:  
   The step size in the search has become less than the tolerance prescribed by 
   the PrecisionGoal option, but the gradient is larger than the tolerance 
   specified by the AccuracyGoal option. There is a possibility that the method 
   has stalled at a point that is not a local minimum. 

{2.1375902350021628*^-19, {a -> 753., b -> -919., c -> 0.0016051364365971107,  
  d -> 2.477886509998064}} 

*) 


(* Create a table of values for the resulting function to compare to 'data' *) 

tab = Table[a+b*Sin[c*x-d], {x,1,Length[data]}] /. sol[[2]]; 

(* The maximal difference is effectively 0 *) 

Max[Abs[data-tab]] // InputForm 

(* Result: 7.73070496506989*^-12 *) 

虽然上面的内容并没有完全回答我的问题,但我还是觉得它有些引人注目。

之前,我尝试使用 FindFit[]Method -> NMinimize(这应该会给出更好的全局拟合),但效果不佳,可能是因为你不能给 FindFit[] 智能的起始值。

我得到的错误让我感到困扰,但似乎与问题无关。


网页内容由stack overflow 提供, 点击上面的
可以查看英文原文,
原文链接