numpy.histogram的density=True参数中的hist维度解释

3

假设我有这个数组 A:

array([ 0.0019879 , -0.00172861, -0.00527226,  0.00639585, -0.00242005,
   -0.00717373,  0.00371651,  0.00164218,  0.00034572, -0.00864304,
   -0.00639585,  0.006828  ,  0.00354365,  0.00043215, -0.00440795,
    0.00544512,  0.00319793,  0.00164218,  0.00025929, -0.00155575,
    0.00129646,  0.00259291, -0.0039758 ,  0.00328436,  0.00207433,
    0.0011236 ,  0.00440795,  0.00164218, -0.00319793,  0.00233362,
    0.00025929,  0.00017286,  0.0008643 ,  0.00363008])

如果我运行:

np.histogram(A, bins=9, density=True)

根据历史记录获得以下信息:

array([  34.21952021,   34.21952021,   34.21952021,   34.21952021,
     34.21952021,  188.20736116,  102.65856063,   68.43904042,
     51.32928032])

手册上说:
"If True, the result is the value of the probability density function at the bin, normalized such that the integral over the range is 1. Note that the sum of the histogram values will not be equal to 1 unless bins of unity width are chosen; it is not a probability mass function."
我认为我对直方图和密度函数有很好的理解,但我真的不明白这些值代表什么或如何计算它们。
我需要用R重现这些值,因为我正在两种语言之间移植一些代码。
开源软件的一个好处是,如果你不知道某个东西是如何计算的,你总可以自己看看 - Alex
谢谢提供链接,非常有趣。但我认为现在调查函数内部构建还超出了我的能力范围。 - goingdeep
1个回答

3
在R中,您可以使用hist()函数绘制直方图。此外,hist是一个产生列表的S3函数。
A <- c(0.0019879 , -0.00172861, -0.00527226,  0.00639585, -0.00242005,
        -0.00717373,  0.00371651,  0.00164218,  0.00034572, -0.00864304,
        -0.00639585,  0.006828  ,  0.00354365,  0.00043215, -0.00440795,
        0.00544512,  0.00319793,  0.00164218,  0.00025929, -0.00155575,
        0.00129646,  0.00259291, -0.0039758 ,  0.00328436,  0.00207433,
        0.0011236 ,  0.00440795,  0.00164218, -0.00319793,  0.00233362,
        0.00025929,  0.00017286,  0.0008643 ,  0.00363008)

这是使用您的向量A生成的默认直方图,由R生成。
hist(A)

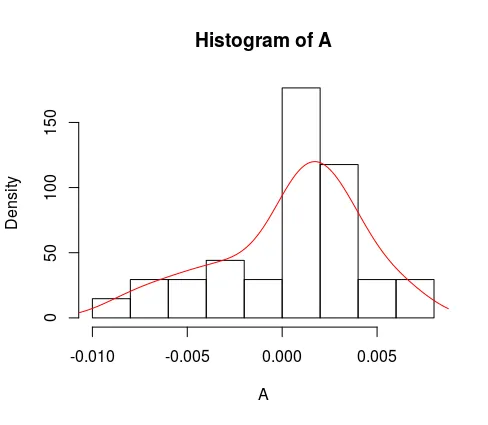
这是一个带有额外密度曲线层的直方图。

hist(A, freq = F)
lines(density(A), col = 'red')

enter image description here

让我们将列表hist(A)存储到p中。

p <- hist(A)

我们现在可以看到列表p的内容。
str(p)
# List of 6
#  $ breaks  : num [1:10] -0.01 -0.008 -0.006 -0.004 -0.002 0 0.002 0.004 # 0.006 0.008
#  $ counts  : int [1:9] 1 2 2 3 2 12 8 2 2
#  $ density : num [1:9] 14.7 29.4 29.4 44.1 29.4 ...
#  $ mids    : num [1:9] -0.009 -0.007 -0.005 -0.003 -0.001 0.001 0.003 0.005 0.007
#  $ xname   : chr "A"
#  $ equidist: logi TRUE
#  - attr(*, "class")= chr "histogram"

密度是指理论密度函数值。这个值可以超过1,但密度曲线下的面积应该等于1。每个条的宽度可以通过直方图中每个条的分界点(breaks)之间的差异来轻松确定。因此,如果我们将直方图每个条的宽度乘以p$density,然后加起来,应该得到总和为1。

sum(diff(p$breaks) * p$density)
# [1] 1

感谢您的帖子,非常有用并且指向了正确的方向,但是为什么我的Python输出与R的输出不同呢?我的最终目标是使用density=True从Python中乘以hist * numpy.diff(bin_edges),但如果我不理解hist是如何计算/代表什么,那就非常困难。也许我可以在R中使用一些变通方法来获得相同的结果。 - goingdeep
那就像在问为什么另一个软件的输出结果与Python或R的输出结果不同一样,因为它们有不同的实现方式。 - hpesoj626
@hpesoj626 你能否详细解释一下你所说的“密度是指理论密度函数值”的意思? - Arpit Agarwal

网页内容由stack overflow 提供, 点击上面的
可以查看英文原文,
原文链接