无法在轴反转时设置范围 - Plotly

4

根据我之前的问题获得的答案,我可以使用Plotly绘制带有旋转轴的图形。

但是,我无法调整轴的范围大小:

我有以下代码:

layout1= go.Layout(title=go.layout.Title(text="A graph",x=0.5),
        xaxis={'title':'y[m]','range':[-10,10]},
        yaxis={'title':'x[m]', 'side':'right'})

# switch the x- and y-coordinates
point_plot=[
            go.Scatter(y=[3],x=[1],name="V0"),
            go.Scatter(y=[5],x=[2],name="GT"),
            go.Scatter(y=[0],x=[0],name="egoCar")
    ]


fig = go.Figure(data=point_plot, layout=layout1)

# reverse the range of the xaxis (which contains the y values)
fig.update_xaxes(autorange="reversed")
fig.show()

如您所见,我希望Y轴(现在是水平的)从-10到10。

然而,我得到的结果是:

enter image description here

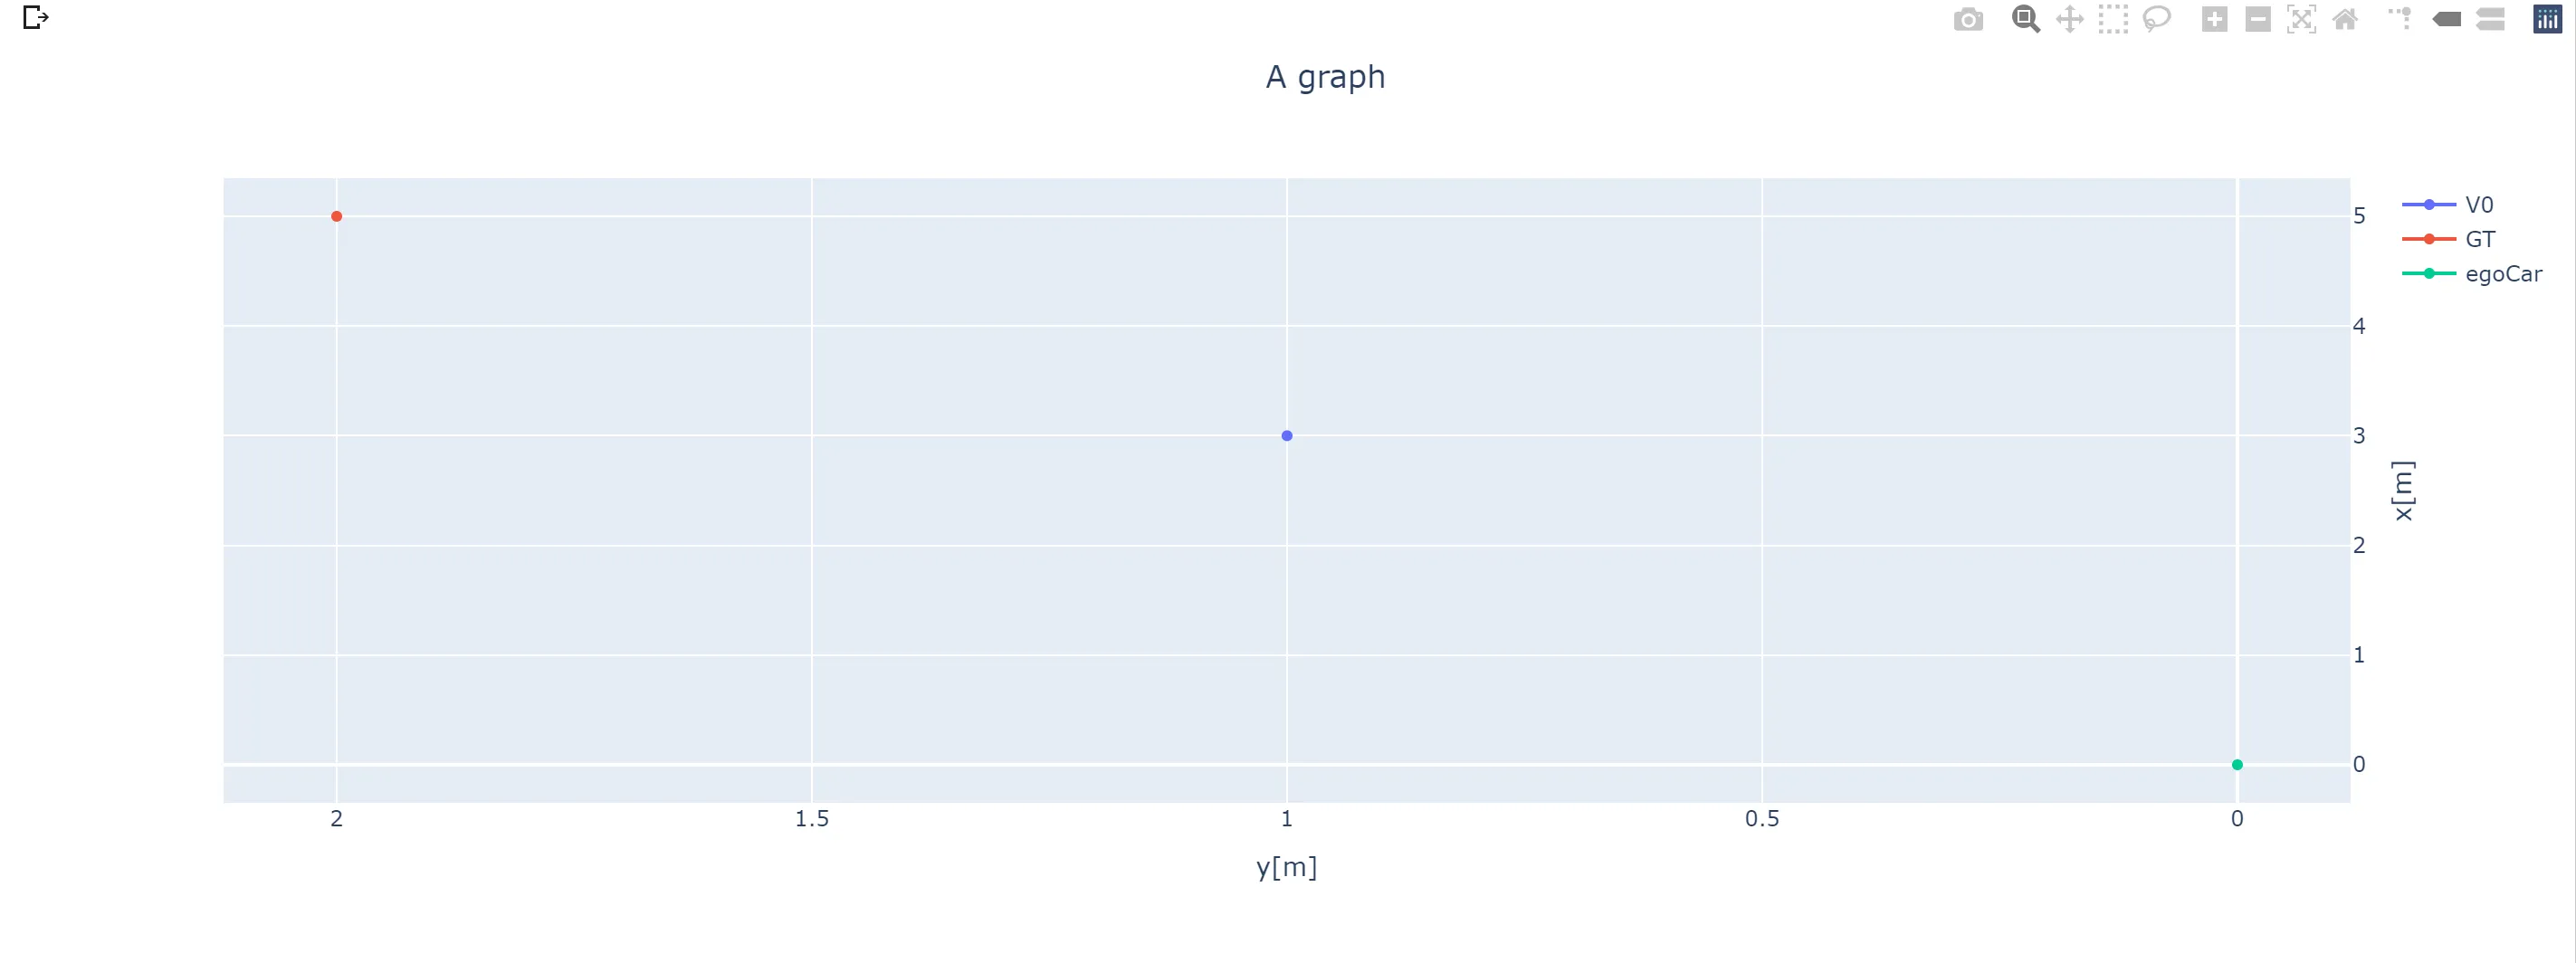
很明显范围不起作用。我猜测这是因为“autorange”,但我需要它来反转Y轴。

我该怎么做?


你尝试过这个吗?fig.update_xaxes(range=[-10,10]) - r-beginners
@r-beginners 是的,它不起作用。 - KansaiRobot
我得到的图表的y轴在左侧为-10,在中间为0,在右侧为10。这不是你想要的形式吗?我不会设置反向模式。 - r-beginners
它必须从-10到10走,但方向相反(因此是“反向”的)。不过我已经找到了一种方法。 - KansaiRobot
1个回答

4
我找到了答案。 显然,要反转轴,你不需要自动调整它,只需将范围设置为倒序即可。
layout1= go.Layout(title=go.layout.Title(text="A graph",x=0.5),
#        xaxis={'title':'y[m]','autorange':'reversed','range':[-10,10]},
        xaxis={'title':'y[m]'},
        yaxis={'title':'x[m]', 'side':'right'})

# switch the x- and y-coordinates
point_plot=[
            go.Scatter(y=[3],x=[1],name="V0"),
            go.Scatter(y=[5],x=[2],name="GT"),
            go.Scatter(y=[0],x=[0],name="egoCar")
    ]


fig = go.Figure(data=point_plot, layout=layout1)

# reverse the range of the xaxis (which contains the y values)
#fig.update_xaxes(autorange="reversed")
fig.update_xaxes(range=[10,-10])  #BACKWARDS
fig.show()

网页内容由stack overflow 提供, 点击上面的
可以查看英文原文,
原文链接