我想知道 geom_density() 究竟是做什么的,以便解释图形,并且是否有提取每个曲线生成的函数或点的方法。
谢谢
输入get("compute_group", ggplot2::StatDensity)(之前是get("calculate", ggplot2:::StatDensity)),可以获取计算密度所用的算法。(实质上,它调用了density()函数,其中默认参数kernel="gaussian"。)
绘图中使用的点通过print.ggplot()隐式返回,因此您可以像这样访问它们:
library(ggplot2)
m <- ggplot(movies, aes(x = rating))
m <- m + geom_density()
p <- print(m)
head(p$data[[1]], 3)
# y x density scaled count PANEL group ymin ymax
# 1 0.0073761 1.0000 0.0073761 0.025917 433.63 1 1 0 0.0073761
# 2 0.0076527 1.0176 0.0076527 0.026888 449.88 1 1 0 0.0076527
# 3 0.0078726 1.0352 0.0078726 0.027661 462.81 1 1 0 0.0078726
## Just to show that those are the points you are after,
## extract and use them to create a lattice xyplot
library(gridExtra)
library(lattice)
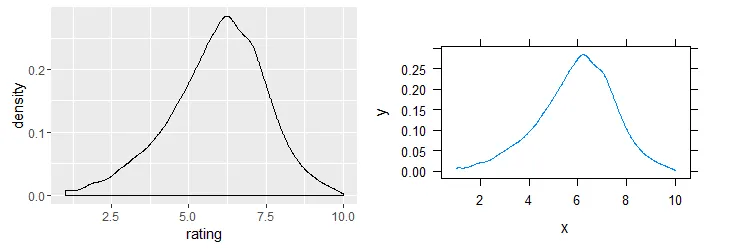
mm <- xyplot(y ~x, data=p$data[[1]], type="l")
如其他答案所建议的那样,您可以使用print.ggplot()访问ggplot点。然而,打印代码还会打印ggplot对象,这可能不是所需的。
你可以使用ggplot_build()提取ggplot对象数据,而不打印图表:
library(ggplot2)
library(ggplot2movies)
m <- ggplot(movies, aes(x = rating))
m <- m + geom_density()
p <- ggplot_build(m) # <---- INSTEAD OF `p <- print(m)`
head(p$data[[1]], 3)
# y x density scaled count n PANEL group ymin
# 1 0.007376115 1.000000 0.007376115 0.02591684 433.6271 58788 1 -1 0
# 2 0.007652653 1.017613 0.007652653 0.02688849 449.8842 58788 1 -1 0
# 3 0.007872571 1.035225 0.007872571 0.02766120 462.8127 58788 1 -1 0
# Just to show that those are the points you are after, extract and use them
# to create a lattice xyplot
library(lattice)
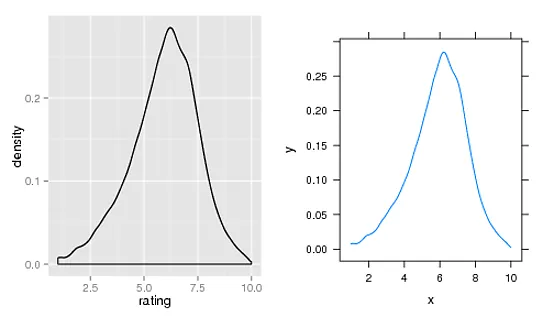
m2 <- xyplot(y ~x, data=p$data[[1]], type="l")
library(gridExtra)
grid.arrange(m, m2, nrow=1)