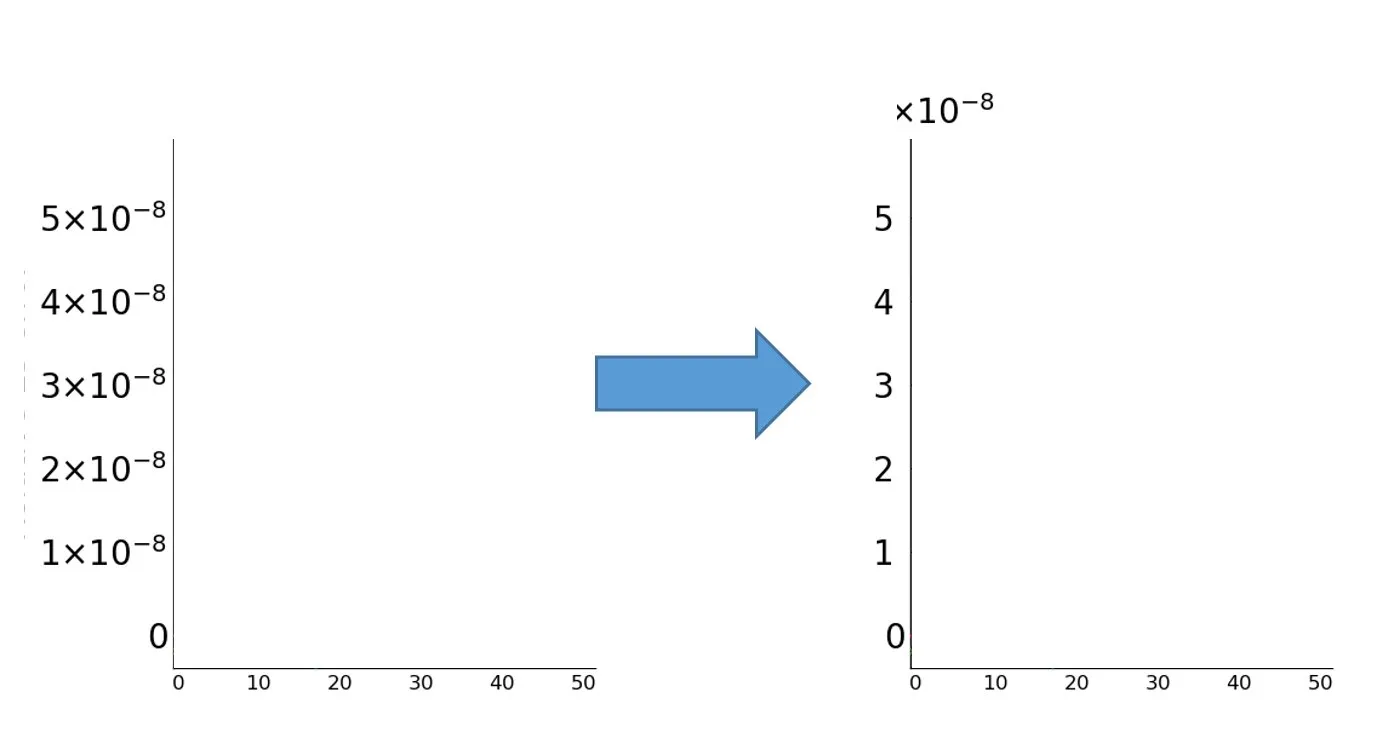
我使用Julia 1.5中的Plots。如何制作如下所示的y轴刻度?
我们有时在科学论文中看到带有正确类型轴的图形。
我们有时在科学论文中看到带有正确类型轴的图形。
Plots.jl 为我们提供了 formatter 坐标轴属性。我们可以将此属性设置为一个函数,该函数接受刻度的数字值并返回字符串作为刻度标签。x=0:0.2:0.8
y=[1,2,3,4,5] * 10^-8
plot(x, y, ytick=y, yaxis=(formatter=y->string(round(Int, y / 10^-8))))
Plots.annotate!和Plots.text,并适当设置注释的位置和大小。这种解决方案的问题是注释可能会溢出绘图区域,并且如果没有设置标题,则可能无法完全显示。如果出现此类问题,可以设置虚拟标题。using LaTeXStrings
x = 0:0.2:0.8
y = [1,2,3,4,5] * 10^-8
plot(x, y, yticks = y, yaxis=(formatter=y->string(round(Int, y / 10^-8))), title=" ")
annotate!([(0, maximum(y) * 1.05, Plots.text(L"\times10^{-8}", 11, :black, :center))])
Printf模块中的工具自动处理它。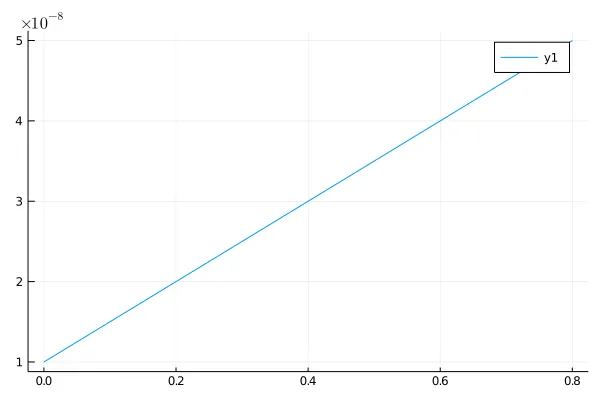
只需在您的绘图函数中添加formatter = :plain:
plot(x, y, formatter = :plain,)
formatter = identity 也是一种选项(用于显示带小数点的数字):
plot(x, y, formatter = identity,)