我在WinForms应用程序中放置了一个图表控件,然后尝试添加一些数据以显示成堆积柱状图。无论我如何努力,都无法使第二个系列正确显示。我通过删除其他所有内容,只留下2个系列和最少量的数据来隔离问题。
图表代码:
System.Windows.Forms.DataVisualization.Charting.ChartArea chartArea1 = new System.Windows.Forms.DataVisualization.Charting.ChartArea();
System.Windows.Forms.DataVisualization.Charting.Legend legend1 = new System.Windows.Forms.DataVisualization.Charting.Legend();
System.Windows.Forms.DataVisualization.Charting.Series series1 = new System.Windows.Forms.DataVisualization.Charting.Series();
System.Windows.Forms.DataVisualization.Charting.Series series2 = new System.Windows.Forms.DataVisualization.Charting.Series();
this.chart1 = new System.Windows.Forms.DataVisualization.Charting.Chart();
((System.ComponentModel.ISupportInitialize)(this.chart1)).BeginInit();
this.SuspendLayout();
//
// chart1
//
chartArea1.Name = "ChartArea1";
this.chart1.ChartAreas.Add(chartArea1);
legend1.Name = "Legend1";
this.chart1.Legends.Add(legend1);
this.chart1.Location = new System.Drawing.Point(49, 62);
this.chart1.Name = "chart1";
series1.ChartArea = "ChartArea1";
series1.ChartType = System.Windows.Forms.DataVisualization.Charting.SeriesChartType.StackedColumn;
series1.Legend = "Legend1";
series1.Name = "Series2";
series2.ChartArea = "ChartArea1";
series2.ChartType = System.Windows.Forms.DataVisualization.Charting.SeriesChartType.StackedColumn;
series2.Legend = "Legend1";
series2.Name = "Series3";
this.chart1.Series.Add(series1);
this.chart1.Series.Add(series2);
this.chart1.Size = new System.Drawing.Size(534, 300);
this.chart1.TabIndex = 0;
this.chart1.Text = "chart1";
数据代码:
chart1.Series["Series2"].Points.Add(new DataPoint(1, 1));
chart1.Series["Series2"].Points.Add(new DataPoint(2, 4));
chart1.Series["Series2"].Points.Add(new DataPoint(3, 5));
chart1.Series["Series3"].Points.Add(new DataPoint(2, 3));
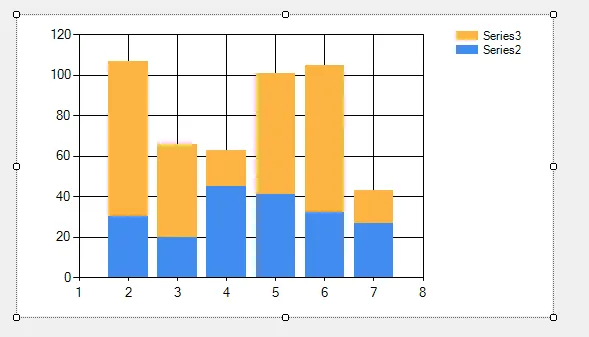
在设计师的图表中,它看起来像这样(正是我想要的):
但是当我运行应用程序时,一个系列从未被显示出来(可能被第一个系列隐藏了...)。
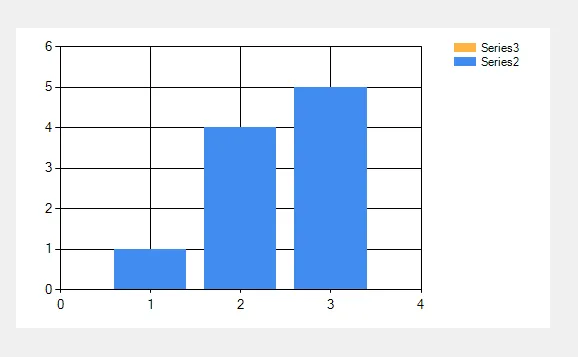
当我改变Series2的第二个点时:
chart1.Series["Series2"].Points.Add(new DataPoint(2, 0));
那么它看起来像这样:
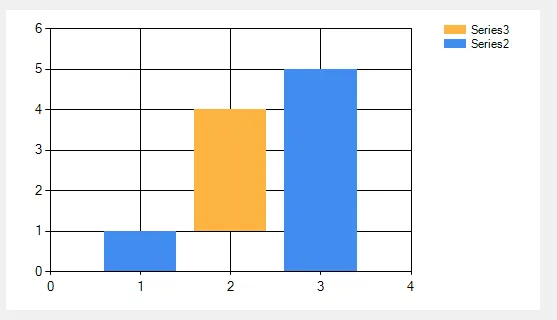
我做错了什么?是个bug吗?我在我的真实应用程序中也尝试使用堆叠和非堆叠列的组合,但总是运行时结果与设计师预览的结果不同(我的意思是列以完全不同的方式显示)。