我想查看OS X中正在运行的进程信息。在终端中运行ps命令只会列出当前打开的终端窗口。如何查看所有正在运行的进程?
比如我正在运行一个网络浏览器、终端和文本编辑器,我想查看文本编辑器和网络浏览器的信息。
你可以使用 top 命令来展示你的 OSX 上正在运行的所有内容。
top 命令只会显示足以填满屏幕的进程,它不会显示 "所有正在运行的进程"。如果想要查看不在可见区域中的进程,应该怎么做? - Jeffps aux 命令或者在打开 top 命令时对进程列表进行排序,例如:
按内存使用量排序:top -o rsize
按 CPU 使用量排序:top -o cpu
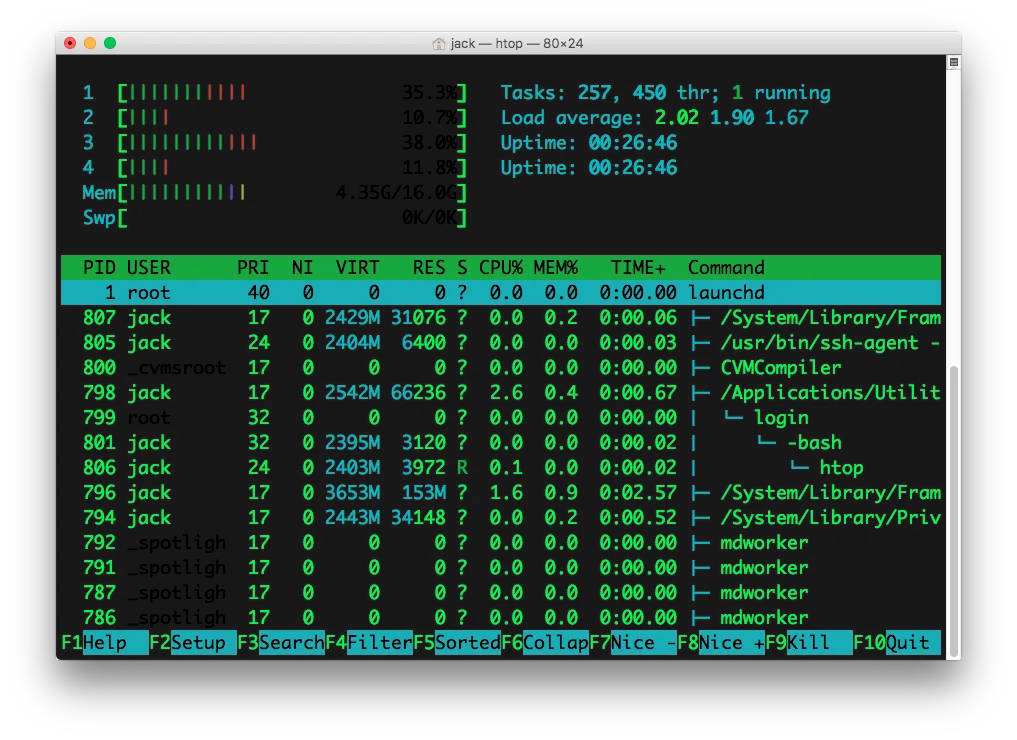
这并不是完整的列表。 - camilo_utop -l 1。-l代表"日志模式",而数字1代表输出的样本数量。 - StaRbUck42使用top和ps是可以的,但我发现使用htop比Mac OS X使用的标准工具更好更清晰。 我最喜欢的用法是在运行时按T键以树形视图查看进程(请参见截屏)。 显示哪些进程相互依赖。
你可以使用Homebrew安装它:
brew install htop
如果您的系统上已经安装了Xcode和相关工具,例如git,并且想要从官方源代码库安装最新的开发代码-只需按照以下步骤操作。
首先从htop GitHub存储库克隆源代码:
git clone git@github.com:hishamhm/htop.git
cd htop
autogen.sh:./autogen.sh
./configure
一旦 configure 进程完成,运行 make 命令:
make
最后通过运行sudo make install来安装它:
sudo make install
尝试运行ps -ef命令。使用man ps可查看所有选项。
 -A      Display information about other users' processes, including those without controlling terminals.

 -e      Identical to -A.

 -f      Display the uid, pid, parent pid, recent CPU usage, process start time, controlling tty, elapsed CPU usage, and the associated command.  If the -u option is also used, display
         the user name rather then the numeric uid.  When -o or -O is used to add to the display following -f, the command field is not truncated as severely as it is in other formats.
top命令。它是一个交互式命令,可以显示运行中的进程。/Applications/Utilities/中)。top或ps手册,因为这些命令有一堆选项),否则这可能是您最好的选择。top -o cpu
如果你使用的是PS,你可以查看手册。
man ps
以下是关键词列表,可供您构建所需内容。例如,显示用户ID / 进程ID / CPU百分比 / 内存百分比 / 工作队列 / 命令:
ps -e -o "uid pid pcpu pmem wq comm"
-e参数类似于-A参数(包括你自己和其他进程),而-o参数是强制指定格式的。
如果您要查找特定的用户UID,可以使用awk或grep进行链式操作,例如:
ps -e -o "uid pid pcpu pmem wq comm" | grep 501
这将(几乎)仅显示用户ID为501的信息。请尝试。
稍微图形化的方式
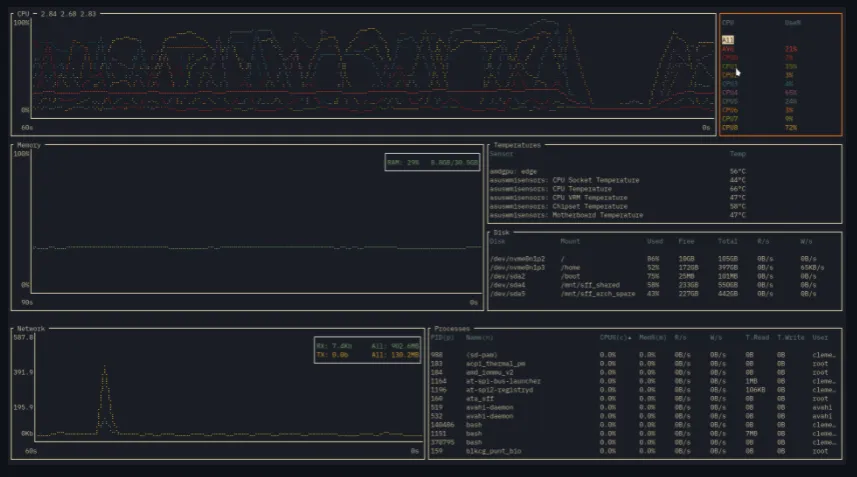
如果你是cli(ui)粉丝,我建议尝试https://github.com/clementtsang/bottom,它不仅显示进程,还显示温度,磁盘使用和网络。屏幕截图是从kitty(终端)运行的示例,我在OSX默认终端上使用它,颜色显示有点不同,但仍然很棒。
树形方式
如此描述: https://en.wikipedia.org/wiki/Pstree 将更好地连接进程的层次结构。
brew install pstree     # if you need to install it
pstree
pstree -u <user>        # show only processes by your user
pstree -s <string>      # show only processes with string
pstree -help            # show help
kill [PID]或kill 83132命令来终止想要关闭的进程。 - Rick Brossps -e结合grep。 - JMD