我已经从以下数据(在csv文件中)生成了一张堆积百分比条形图:
,ONE,TWO,THREE
1,2432,420,18
2,276,405,56
3,119,189,110
4,90,163,140
5,206,280,200
6,1389,1080,1075
7,3983,3258,4878
8,7123,15828,28111
9,8608,48721,52576
10,9639,44725,55951
11,8323,45695,32166
12,2496,18254,26600
13,1524,8591,18583
14,7861,1857,1680
15,10269,5165,4618
16,13560,64636,63262
使用以下代码
library(ggplot2)
library(reshape2)
library(scales)

data <- read.csv(file="file.csv",sep=",",header=TRUE)
data <- data[,2:ncol(data)]
datam <- melt(cbind(data,ind = sort(rownames(data))),is.var = c('ind'))
datam$ind <- as.numeric(datam$ind)
ggplot(datam,aes(x = variable, y = value,fill = factor(as.numeric(ind)))) +
geom_bar(position = "fill") + scale_y_continuous(labels =percent_format()) +
scale_fill_discrete("Barcode\nMatch")  +xlab("Barcode")+ylab("Reads")
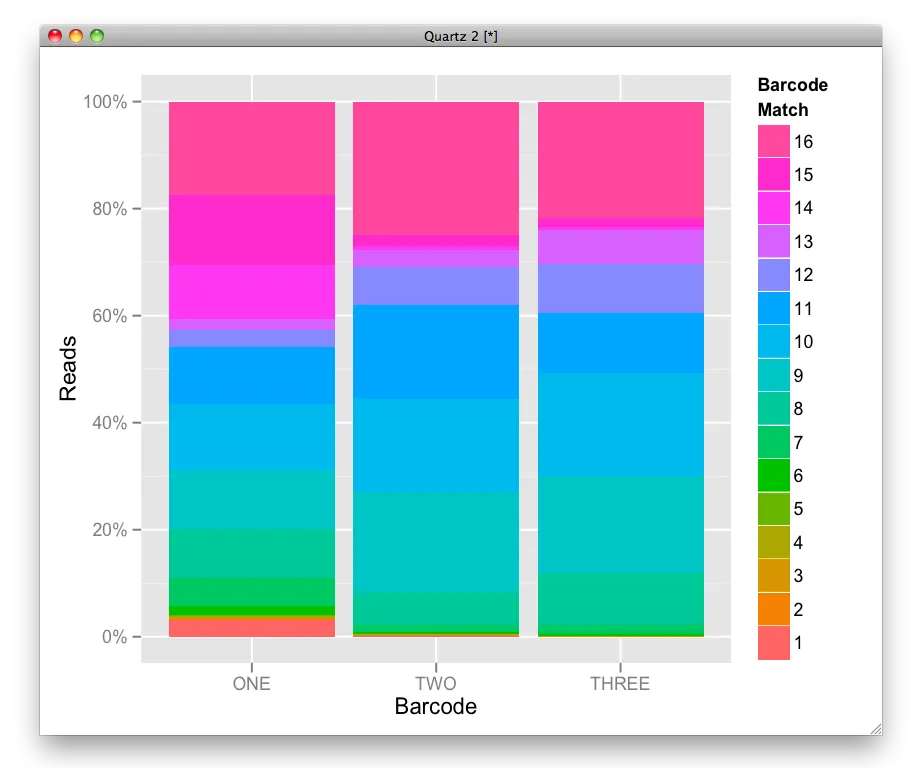
结果是
问题是图例中的项目顺序与它们所代表的堆栈不一致。颜色和数字是正确的,但是顺序不对。换句话说,有没有一种方法可以反转图例中项目的顺序?谢谢