我明白“scale”同时改变两个参数,但我想实现的效果是在大标记之间有一条细线连接。
我还尝试通过“rc{'lines.linewidth' = 1, 'lines.markersize' = 5}”进行调整大小,但结果是将标记大小和线宽一起缩放,而不是独立设置它们。实际上,由于某种原因,“markersize”没有任何效果。
编辑:添加了图表和代码以显示问题。
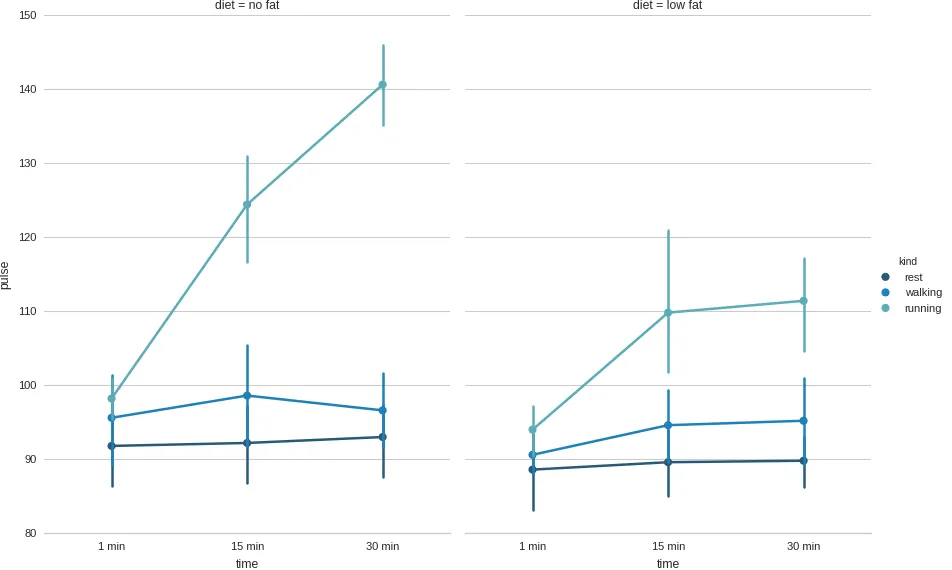
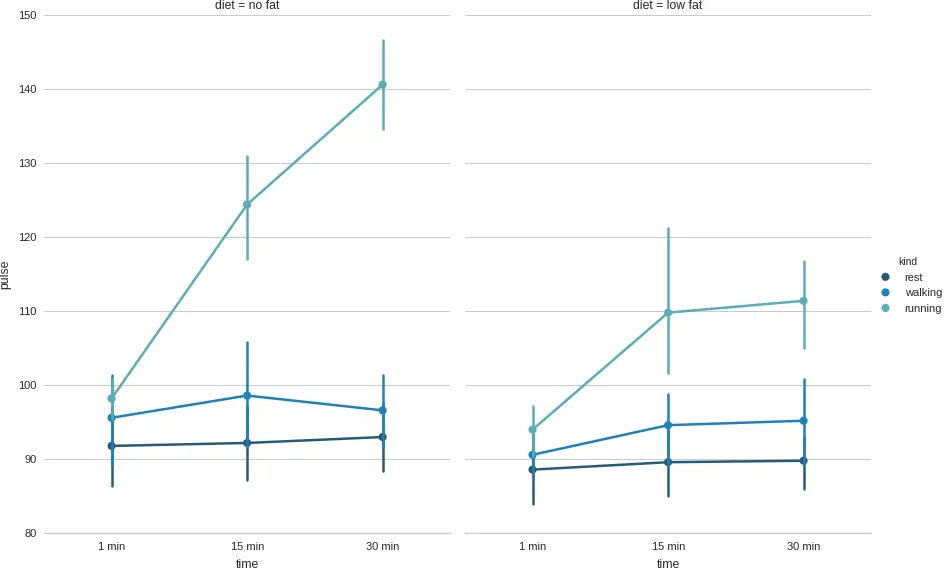
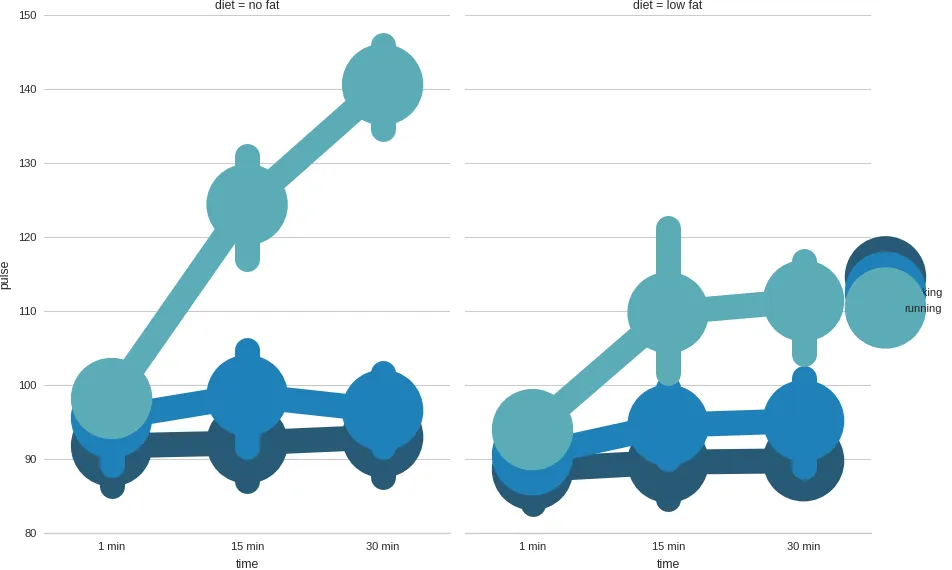
下面的前两个图形分别使用markersize 1和10创建。如图所示,它们看起来具有相同的markersize。最后一个图形使用
我还尝试通过“rc{'lines.linewidth' = 1, 'lines.markersize' = 5}”进行调整大小,但结果是将标记大小和线宽一起缩放,而不是独立设置它们。实际上,由于某种原因,“markersize”没有任何效果。
编辑:添加了图表和代码以显示问题。
import seaborn as sns

sns.set(style="whitegrid")
paper_rc = {'lines.linewidth': 1, 'lines.markersize': 10}
sns.set_context("paper", rc = paper_rc)

# Load the example exercise dataset
df = sns.load_dataset("exercise")

# Draw a pointplot to show pulse as a function of three categorical         factors
g = sns.factorplot(x="time", y="pulse", hue="kind", col="diet", data=df,
                       palette="YlGnBu_d", size=6, aspect=.75)
g.despine(left=True)
下面的前两个图形分别使用markersize 1和10创建。如图所示,它们看起来具有相同的markersize。最后一个图形使用
line.linewidth=10 line.markersize=1,这会同时放大线宽和标记大小。