gnuplot:在循环中设置线条样式

3
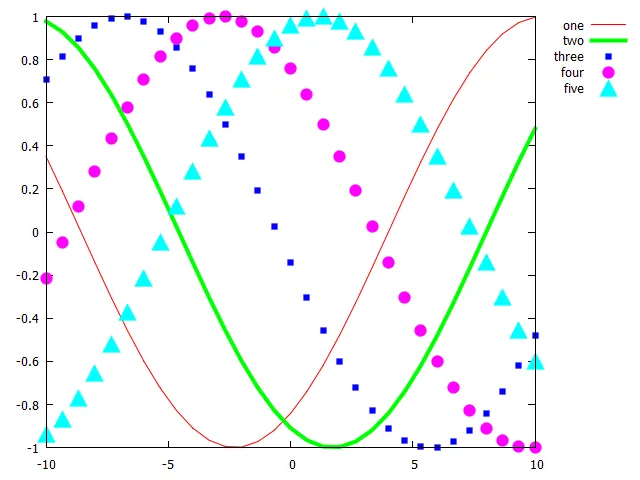
我需要在同一张图上绘制几条曲线。我必须使用for循环来实现这个目标。我想用线条绘制前两条曲线,用点绘制其余的曲线。我可以绘制所有曲线的线条或所有曲线的点,但无法在同一for循环中进行更改。
以下是我代码的相关部分:
set style line 1 lw 1 lc rgb "green"
set style line 2 lw 1 lc rgb "purple"
set style line 3 pt 1 ps 1.0 lc rgb "red"
set style line 4 pt 2 ps 1.0 lc rgb "red"
set style line 5 pt 3 ps 1.0 lc rgb "red"
plot for [i=1:words(FILES)] myDataFile(i) u (column(1)):((word(UTAUS_ch,i))) ls i title myTitle(i)

我想在“ls i”之前加上“w l”以绘制前两条曲线,并在其他曲线上使用“ls i”。我尝试使用if语句,将“ls i”替换为“if (i < 2) {w l ls i} else {ls i}”,但Gnuplot不希望在此处找到if语句。
有谁能帮助我吗? 谢谢, 马丁

1
请查看此链接... https://stackoverflow.com/a/61692635/7295599 - theozh
2个回答

2
此处所述,在plot for循环内部可能无法切换绘图样式。因此,您可以执行两个单独的循环,一个使用with points,另一个使用with lines;或者您可以执行一个循环with linespoints,并将所有必要的点和线参数定义为函数(以保持绘图命令的可读性)。 如此处所述,linewidth 0不是零,而是最细的线条,通常为1像素。要使线条完全消失,您必须使用linetype -2

代码:

### lines and points in the same plot for-loop
reset session

LINECOLORS = "red  green blue  magenta cyan"
LINEWIDTHS = '1.0  4.0   0.0   0.0     0.0'
POINTTYPES = '0    0     5     7       9'
POINTSIZES = '0    0     1.0   2.0     3.0'
TITLES     = 'one  two   three four    five'

myLinecolor(i) = word(LINECOLORS,i)
myLinewidth(i) = real(word(LINEWIDTHS,i))
myPointtype(i) = int(word(POINTTYPES,i))
myPointsize(i) = real(word(POINTSIZES,i))
myLinetype(i) = myLinewidth(i) == 0 ? -2 : 1
myTitle(i) = word(TITLES,i)

set samples 31
set key out

plot for [i=1:words(TITLES)] (sin(0.25*x-i)) w lp pt myPointtype(i) ps myPointsize(i) \
    lt myLinetype(i) lw myLinewidth(i) lc rgb myLinecolor(i) title myTitle(i)
### end of code

结果:

enter image description here

补充:

为了使绘图命令尽可能简短和清晰,您还可以定义线条样式,并通过ls iplot for命令中使用它,与上述结果相同。

...

do for [i=1:words(TITLES)] {
    set style line i pt myPointtype(i) ps myPointsize(i) \
        lt myLinetype(i) lw myLinewidth(i) lc rgb myLinecolor(i)
}

plot for [i=1:words(TITLES)] (sin(0.25*x-i)) w lp ls i title myTitle(i)

1

这里有一种使用宏的方法:

set style line 1 lw 1 lc rgb "green"
set style line 2 lw 1 lc rgb "purple"
set style line 3 pt 1 ps 1.0 lc rgb "red"
set style line 4 pt 2 ps 1.0 lc rgb "red"
set style line 5 pt 3 ps 1.0 lc rgb "red"

set samp 100
set macro
cmd = ''
do for [i=1:10] {s = i<3? 'w l' : 'ls '.i; 
                 cmd = cmd . '"+" us  1:(sin(x-'.i.'/10.)) '.s.' title "key '.i.'",'}

plot [0:2*pi] @cmd

enter image description here


网页内容由stack overflow 提供, 点击上面的
可以查看英文原文,
原文链接