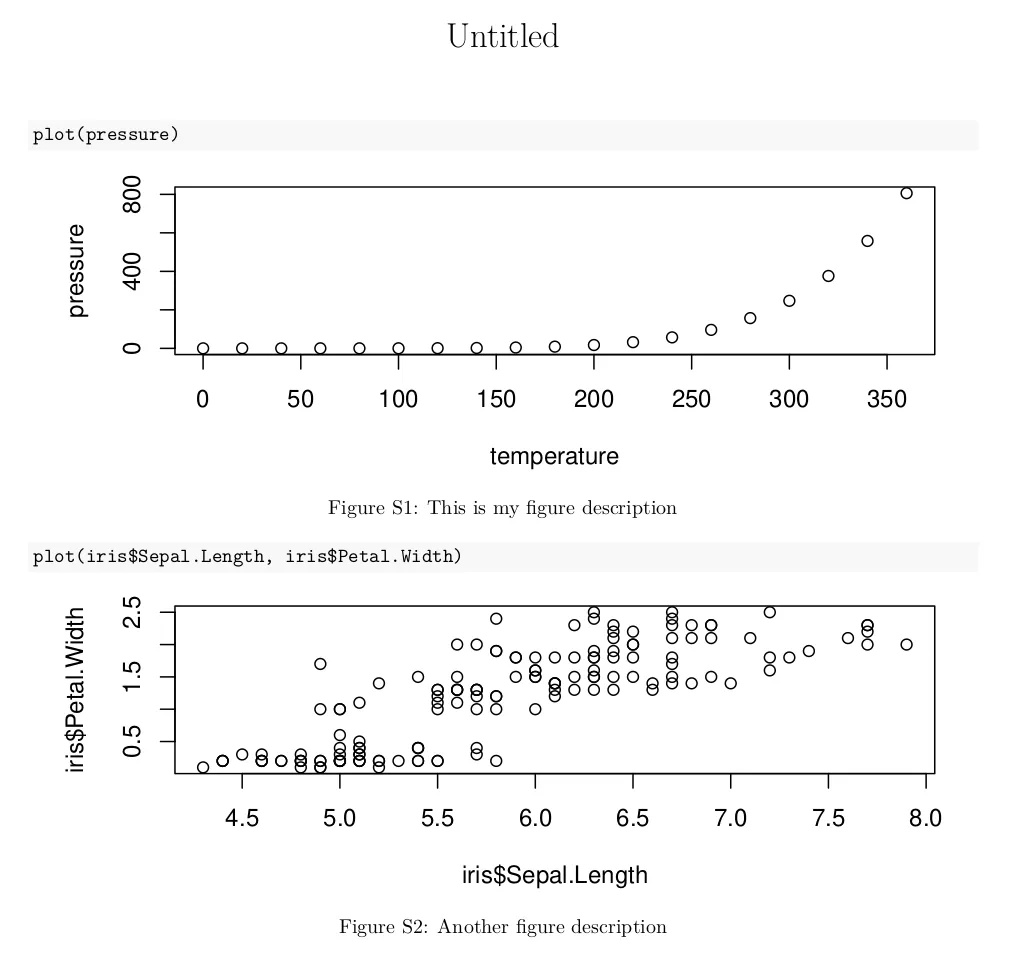
按照此指南设置Word (.docx)样式,您可以将fig.和tab.字幕设置为加粗,尽管整个字幕行都可以加粗……我的意思是我们有一种自动创建.docx中的字幕的方法,类似于RMarkdown中的这个:
Figure S1: Single-crystal X-ray structure of some text (1)
但是,仍然似乎很难像这样创建一个:
Figure S1: Single-crystal X-ray structure of some text (1)
我想您只想使"Figure/Table S1"部分加粗,而不是整个字幕行。然而,如果您有兴趣使用Rmarkdown格式化.docx文件,则可以查看我添加的链接并查看以下说明。
1. 使用@LmW提供的.Rmd文件进行编织以获得第一个.docx输出。
如果您在captioner软件包方面遇到问题,也可以使用以下软件包。
---
title: Supporting Information
subtitle: "Iron(I) etc"
author: "Some people here"
abstract: "Added the addresses here since there is no abstract in the SI"
output:
word_document:
fig_caption: yes
---
```{r, include=F}
library(captioner)
#`captioner` package (Ver. 2.2.3) in my envionment returns the following error messages:
#Error in captioner(prefix = "Table S", suffix = ". ", style = "b", style_prefix = TRUE, :
# unused arguments (suffix = ". ", style = "b", style_prefix = TRUE)
#Error in captioner(prefix = "Figure S", suffix = ". ", style = "b", style_prefix = TRUE, :
# unused arguments (suffix = ". ", style = "b", style_prefix = TRUE)
#tables <- captioner(prefix = "Table S", suffix = ". ", style="b", style_prefix=TRUE, auto_space = FALSE)
#figures <- captioner(prefix = "Figure S", suffix = ". ", style="b", style_prefix=TRUE, auto_space = FALSE)
tables <- captioner(prefix = "Table S", auto_space = FALSE)
figures <- captioner(prefix = "Figure S", auto_space = FALSE)
figures("Xray1", "Single-crystal X-ray structure of some text (1)", display=FALSE)
figures("Xray2", "Single-crystal X-ray structure of some text (2)", display=FALSE)
figures("Xray3", "Single-crystal X-ray structure of some text (3)", display=FALSE)
```
Some text. Some text followed by `r figures("Xray1", display="cite")`, which is the same figure as `r figures("Xray3", display="cite")` but comes after `r figures("Xray2", display="cite")`.
```{r Xray, fig.cap=figures("Xray1"), echo=FALSE}
plot(cars)
```
```{r Xray2, fig.cap=figures("Xray2"), echo=FALSE}
plot(cars)
```
```{r Xray3, fig.cap=figures("Xray3"), echo=FALSE}
plot(cars)
```
Some text etc. followed by `r tables("tab-DipUVvis", display="cite")`:
```{r DipUVvis, echo=FALSE}
df<-data.frame(Entry=c('AMM 51$3^a$','AMM 52^*a*^'),
Precat=c('[FeBr~2~(dpbz)~2~] (4.00)','[FeBr~2~(dpbz)~2~]
(2.00)'))
knitr::kable(head(df), caption=tables("tab-DipUVvis", "Table Caption"))
```
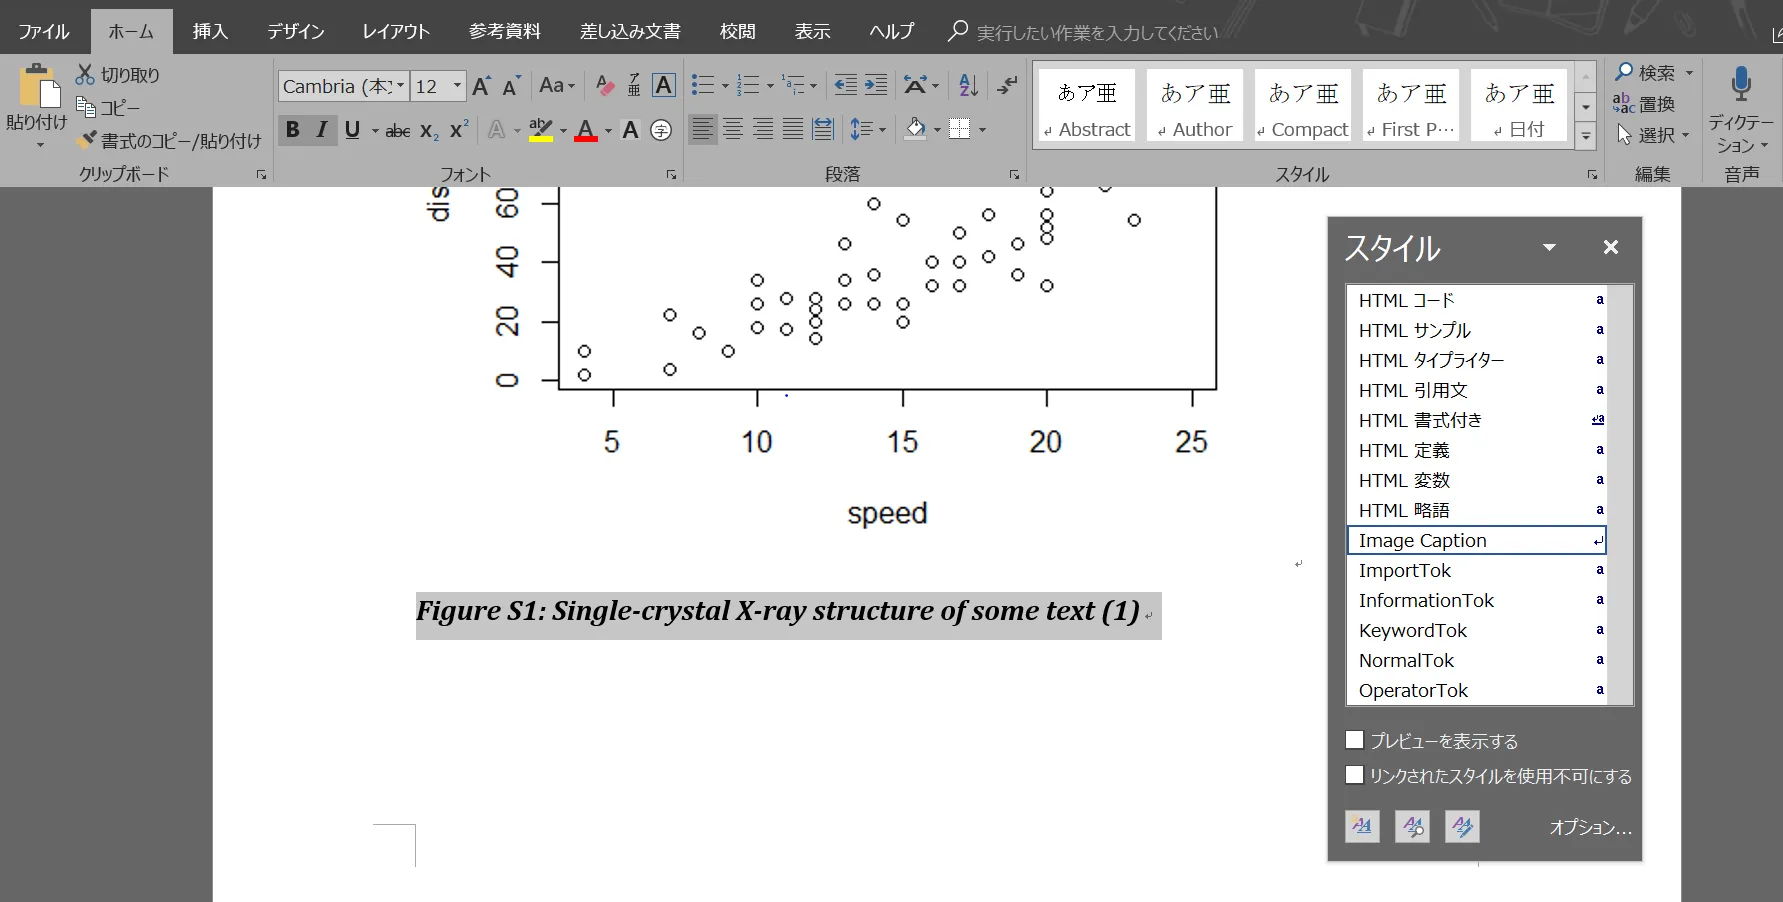
2. 将 Image Caption 和 Table Caption 设为加粗。
在第一个 .docx 文件中:
- 选择一张图片标题或表格标题;
- 将其设为加粗(
Ctrl + B 或 Command + B);
- 点击主页选项卡中样式设置的右下角或按下
Alt + Ctrl + Shift + S;
- 找到
Image Caption 或 Table Caption;
- 点击它的下拉菜单并点击更新所选内容以匹配标题。
如果你已经在 Image Caption 和 Table Caption 中完成了上述步骤,请确保将 .docx 文件保存为 word-styles-reference-01.docx,并放在你的工作目录中。
3. 通过添加 reference_docx 行来编织 .Rmd 文件,从而获得最终的 .docx 输出文件。
在 word_document: 行下添加 reference_docx: word-styles-reference-01.docx。请参见以下示例中的第 7 行。
---
title: Supporting Information
subtitle: "Iron(I) etc"
author: "Some people here"
abstract: "Added the addresses here since there is no abstract in the SI"
output:
word_document:
reference_docx: word-styles-reference-01.docx
fig_caption: yes
---
```{r, include=F}
library(captioner)
#`captioner` package (Ver. 2.2.3) in my envionment returns the following error messages:
#Error in captioner(prefix = "Table S", suffix = ". ", style = "b", style_prefix = TRUE, :
# unused arguments (suffix = ". ", style = "b", style_prefix = TRUE)
#Error in captioner(prefix = "Figure S", suffix = ". ", style = "b", style_prefix = TRUE, :
# unused arguments (suffix = ". ", style = "b", style_prefix = TRUE)
#tables <- captioner(prefix = "Table S", suffix = ". ", style="b", style_prefix=TRUE, auto_space = FALSE)
#figures <- captioner(prefix = "Figure S", suffix = ". ", style="b", style_prefix=TRUE, auto_space = FALSE)
tables <- captioner(prefix = "Table S", auto_space = FALSE)
figures <- captioner(prefix = "Figure S", auto_space = FALSE)
figures("Xray1", "Single-crystal X-ray structure of some text (1)", display=FALSE)
figures("Xray2", "Single-crystal X-ray structure of some text (2)", display=FALSE)
figures("Xray3", "Single-crystal X-ray structure of some text (3)", display=FALSE)
```
Some text. Some text followed by `r figures("Xray1", display="cite")`, which is the same figure as `r figures("Xray3", display="cite")` but comes after `r figures("Xray2", display="cite")`.
```{r Xray, fig.cap=figures("Xray1"), echo=FALSE}
plot(cars)
```
```{r Xray2, fig.cap=figures("Xray2"), echo=FALSE}
plot(cars)
```
```{r Xray3, fig.cap=figures("Xray3"), echo=FALSE}
plot(cars)
```
Some text etc. followed by `r tables("tab-DipUVvis", display="cite")`:
```{r DipUVvis, echo=FALSE}
df<-data.frame(Entry=c('AMM 51$3^a$','AMM 52^*a*^'),
Precat=c('[FeBr~2~(dpbz)~2~] (4.00)','[FeBr~2~(dpbz)~2~]
(2.00)'))
knitr::kable(head(df), caption=tables("tab-DipUVvis", "Table Caption"))
```