ggarrange:合并多个图形

4

enter image description here

附上的图片来自以下文章,使用ggarrange将这些图合并在一起: http://www.sthda.com/english/articles/24-ggpubr-publication-ready-plots/81-ggplot2-easy-way-to-mix-multiple-graphs-on-the-same-page/
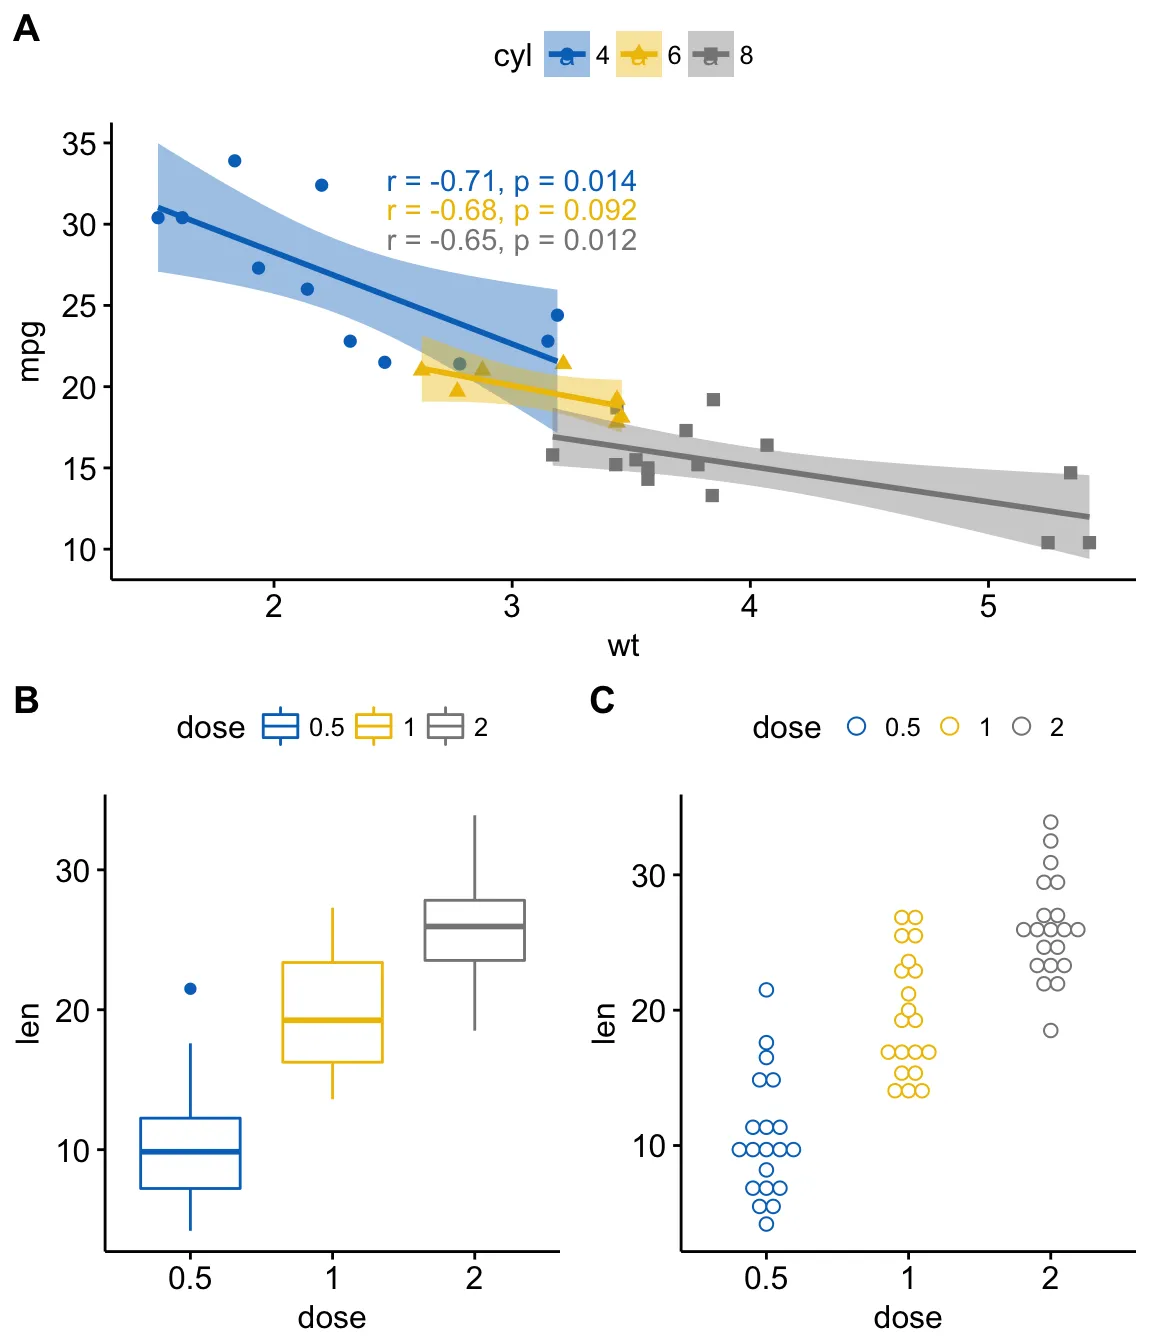
ggarrange(sp,                                                 # First row with scatter plot
          ggarrange(bxp, dp, ncol = 2, labels = c("B", "C")), # Second row with box and dot plots
          nrow = 2, 
          labels = "A"                                        # Labels of the scatter plot
          ) 

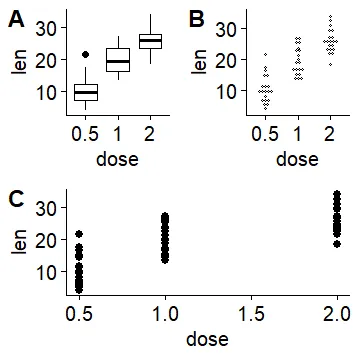
我希望创建相同的图表,但不是在底部有两个较小的图表和一个较大的顶部图表,而是反过来:在顶部有两个小图表(A和B),在底部有一个较大的图表C。
我尝试使用以下代码但没有成功:
ggarrange(
  plot1, plot2,           
  ggarrange(plot3, nrow = 2, labels = c("C")), 
  ncol = 2, 
  labels = c("A","B")       
) 

使用这段代码,我只能在左上角看到plot3图表。


2
尝试使用标签ggarrange(ggarrange(plot1, plot2, ncol=2), plot3, nrow=2) - Edward
3个回答

6

使用patchwork软件包可以使这项工作变得更加容易。

library(patchwork)
(plot1 | plot2) / plot3 + plot_annotation(tag_levels ="A")

3
为了正确放置第三个标签,我们需要在第一个调用中再次调用ggarrange
ggarrange(ggarrange(bxp, dp, ncol = 2, labels = c("A", "B")), 
          ggarrange(sp, labels = "C"), 
          nrow = 2)

1
你只需要将图表按正确的顺序排列,然后在第二个标签的第一个元素中添加一个空格即可。
library(ggplot2); library(ggpubr)

bxp <- ggboxplot(ToothGrowth, x = "dose", y = "len")
dp <- ggdotplot(ToothGrowth, x = "dose", y = "len")
scp <- ggscatter(ToothGrowth, x = "dose", y = "len")

ggarrange(ggarrange(bxp, dp, ncol = 2, labels = c("A", "B")), scp, 
          labels = c("","C"), nrow = 2)

enter image description here


网页内容由stack overflow 提供, 点击上面的
可以查看英文原文,
原文链接