Gnuplot:未定义/缺失数据点和绘图样式“with image”

4
我需要创建一个颜色地图,并且使用“with image”绘图样式可以完全满足我的需求(在位置x,y处绘制z的确切值,因此对我来说不能使用pm3d)。但问题是,我的数据文件中存在未定义的点。例如,该函数表示质量比,因此负的z值没有物理意义,我想省略它们。或者某些z值甚至是“NaN”。示例数据文件:
1.0   1.0    1.5
1.0   2.0    1.7
1.0   3.0    1.9
2.0   1.0    1.6
2.0   2.0    1.8
2.0   3.0    2.0
3.0   1.0    1.7
3.0   2.0    1.9
3.0   3.0   -1.0

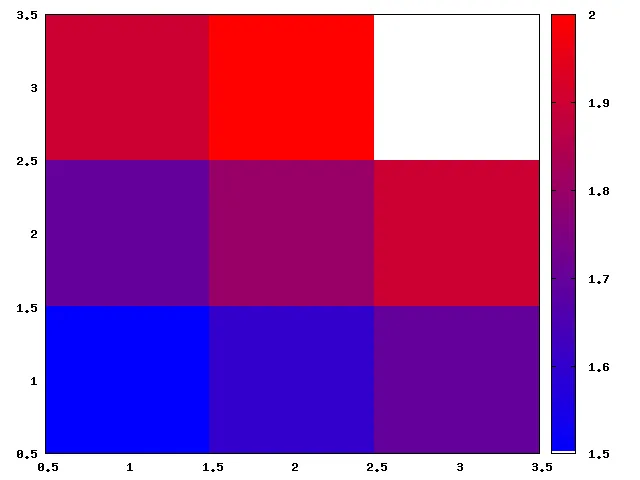
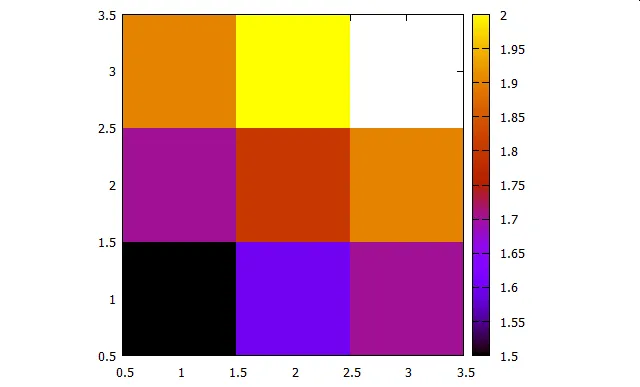
所以我不想在位置 (3,3) 绘制值为 -1 的图形,而是让像素点 (3,3) 保持空白。
我尝试了这个:
plot './test.dat' u 1:2:($3>0 ? $3 : 1/0) with image

但它无法正常工作。它显示如下信息:
警告:像素数量无法分解为与网格匹配的整数。N = 8 K = 3
set datafile missing "NaN"

在将-1.0替换为"NaN"的情况下也不起作用。我找到的唯一替代方案是:
set pointsize 10
plot './test.dat' u 1:2:($3>0 ? $3 : 1/0) palette pt 5

但是我必须手动调整每个图的点大小、x和y轴范围以及绘图大小,以避免数据点之间出现空白或重叠。(见this question。)
长话短说:是否有办法在未定义/缺失数据点的情况下使用“带图像”绘图样式,并将这些点保留为白色?
2个回答

2

我还没有找到一种方法来使gnuplot在这种情况下处理NaN更好。它会将其设置为1,这似乎很奇怪,但可能是因为'plot ... with image'如何处理缺失数据的特性。

如果你只想消除负数,有一个小技巧:

#!/usr/bin/env gnuplot

set terminal png 
set output 'test.png'

filter(x) = (x > 0) ? x : 1/0 
philter(x) = (x > 0) ? x : 0 

# just in case
set zero 1e-20

# make points set to zero be white
set palette defined (0 1.0 1.0 1.0, \
                 1e-19 0.0 0.0 1.0, \
                     1 1.0 0.0 0.0)

# get min/max for setting color range
stats 'test.dat' u (filter($3)) nooutput

# set color range so minimum value is not plotted as white
set cbrange [STATS_min*(1-1e-6):STATS_max]

plot './test.dat' u 1:2:(philter($3)) with image

在您的数据文件中,它会生成这个图表: enter image description here

这并不完美,因为颜色条底部有白色部分,而且它不能处理NaN。无法消除白色部分的原因是,在设置调色板时,使用的数字只是自动缩放以适应颜色条,并且调色板中有一定数量的插槽(256?)。因此,调色板中的第一个插槽将始终显示调色板的起始值(白色),而不管调色板中的下一个颜色是否显示在比例尺的1e-19处。


谢谢你的回答,这很有帮助 ;) 在 pngcairo 终端中看起来不错(cb 底部没有白色部分)。 - Regenbogenmaschine

0

仅供记录,解决方案可以简单如下:将 1/0 替换为 NaN

在 gnuplot 4.6.0(2012年3月),1/0 将显示以下消息:warning: Number of pixels cannot be factored into integers matching grid. N = 8 K = 3 并且不会绘制任何内容,但是 NaN 似乎能够正常工作。

对于 gnuplot≥5.0 的两个版本,1/0NaN 都可以得到期望的结果。

数据:SO14235928.dat

1.0   1.0    1.5
1.0   2.0    1.7
1.0   3.0    1.9
2.0   1.0    1.6
2.0   2.0    1.8
2.0   3.0    2.0
3.0   1.0    1.7
3.0   2.0    1.9
3.0   3.0   -1.0
脚本:(适用于 gnuplot>=4.6.0,2012年3月)
### plot with image with blanked values
reset

FILE = "SO14235928.dat"

set size ratio -1
plot FILE u 1:2:($3>0 ? $3 : NaN) w image notitle
### end of script

结果:(由gnuplot 4.6.0创建)

enter image description here


网页内容由stack overflow 提供, 点击上面的
可以查看英文原文,
原文链接