我需要绘制以下图表,以便为逻辑回归模型选择最佳阈值。
然而,我无法使用许多我所做的研究中使用的软件包(epi和roc)。我确实有pROC软件包。是否有任何方法可以使用此软件包绘制图形?另外,我还可以如何选择最佳阈值?仅使用ROC曲线如何工作?
然而,我无法使用许多我所做的研究中使用的软件包(epi和roc)。我确实有pROC软件包。是否有任何方法可以使用此软件包绘制图形?另外,我还可以如何选择最佳阈值?仅使用ROC曲线如何工作?
library(pROC)
data(aSAH)
myroc <- roc(aSAH$outcome, aSAH$ndka)
mycoords <- coords(myroc, "all")
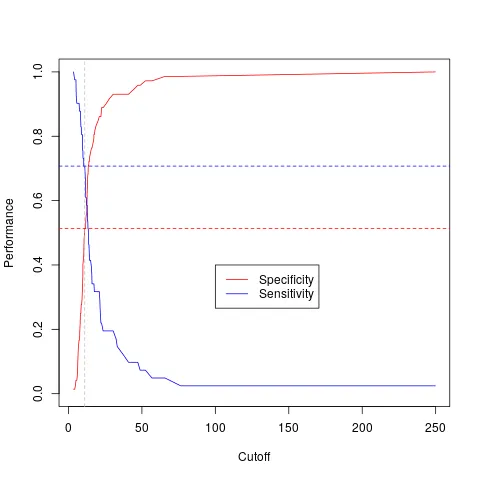
plot(mycoords["threshold",], mycoords["specificity",], type="l",
     col="red", xlab="Cutoff", ylab="Performance")
lines(mycoords["threshold",], mycoords["sensitivity",], type="l",
      col="blue")
legend(100, 0.4, c("Specificity", "Sensitivity"),
       col=c("red", "blue"), lty=1)
best.coords <- coords(myroc, "best", best.method="youden")
abline(v=best.coords["threshold"], lty=2, col="grey")
abline(h=best.coords["specificity"], lty=2, col="red")
abline(h=best.coords["sensitivity"], lty=2, col="blue")
使用pROC,您可以更改“最佳”阈值的标准。请参阅?coords帮助页面以及best.method和best.weights参数,以快速调整它。您可能需要查看OptimalCutpoints package以获取更高级的方法来选择自己的最优解。
输出图应该类似于这样: