我的最终目标是编写一个脚本,可以任意更改
kmeans 群集的数量,并快速可视化结果,使用
voronoi 多边形覆盖所需区域。
我还没有完全实现这一点,但我已经取得了足够的进展,我认为发布我所拥有的内容可能会带来更快的解决方案。
input <- as.data.frame(cbind(x$long, x$lat))
colnames(input) <- c("long", "lat")
set.seed(123)
km <- kmeans(input, 35)
centers <- as.data.frame(cbind(km$centers[,1], km$centers[,2]))
colnames(centers) <- c("long", "lat")
cent.id <- cbind(ID = 1:dim(centers)[1], centers)
coords <- centers[,1:2]
vor_pts <- SpatialPointsDataFrame(coords, centers, proj4string = CRS("+proj=longlat +datum=WGS84"))
我在网上寻找解决方案时,也发现了以下内容:
function。
SPdf_to_vpoly <- function(sp) {
vor_desc <- tile.list(deldir(sp@coords[,1], sp@coords[,2]))
lapply(1:length(vor_desc), function(i) {
tmp <- cbind(vor_desc[[i]]$x, vor_desc[[i]]$y)
tmp <- rbind(tmp, tmp[1,])
Polygons(list(Polygon(tmp)), ID = i)
}) -> vor_polygons
sp_dat <- sp@data
rownames(sp_dat) <- sapply(slot(SpatialPolygons(vor_polygons), 'polygons'), slot, 'ID')
SpatialPolygonsDataFrame(SpatialPolygons(vor_polygons), data = sp_dat)
}
有了上述函数的定义,就可以相应地提取多边形。
vor     <- SPdf_to_vpoly(vor_pts)
vor_df  <- fortify(vor)
为了使
voronoi 多边形与美国地图相匹配,我从
Census 网站下载了
cb_2014_us_state_20m 并运行了以下命令:
us.shp <- readOGR(dsn = ".", layer = "cb_2014_us_state_20m")
state.abb <- state.abb[!state.abb %in% c("HI", "AK")]
Low48 <- us.shp[us.shp@data$STUSPS %in% state.abb,]
Low48.poly <- as(Low48, "SpatialPolygons")
vor.poly <- as(vor, "SpatialPolygons")
proj4string(vor.poly) <- proj4string(Low48.poly)
intersect <- gIntersection(vor.poly, Low48.poly, byid = T)
Low48_df <- fortify(Low48.poly)
int_df <- fortify(intersect)
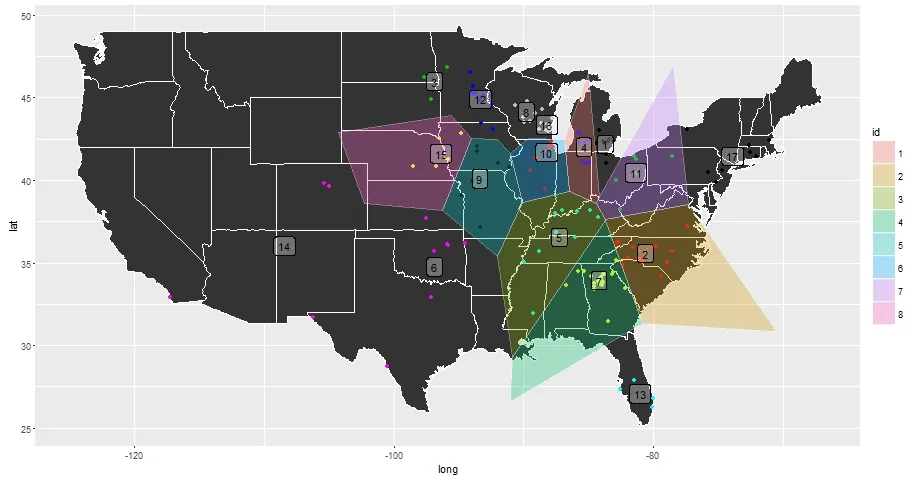
从这里开始,我可以像以前一样使用ggplot来可视化我的结果:
StateMap <- ggplot() + geom_polygon(data = Low48_df, aes(x = long, y = lat, group = group), col = "white")
StateMap +
geom_polygon(data = int_df, aes(x = long, y = lat, group = group, fill = id), alpha = .4) +
geom_point(data = input, aes(x = long, y = lat), col = factor(km$cluster)) +
geom_label(data = centers, aes(x = long, y = lat, label = row.names(centers)), alpha =.2) +
scale_fill_hue(guide = 'none') +
coord_map("albers", lat0 = 30, lat1 = 40)
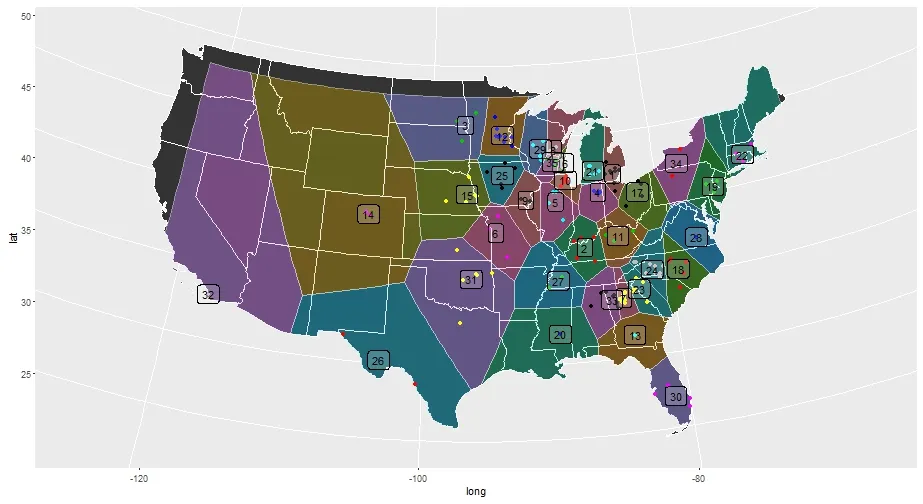
更新摘要
重叠的voronoi多边形仍然不是完美匹配(我猜测这是由于太平洋西北地区缺乏输入数据),尽管我想这应该是一个简单的修复,我会尽快更新。此外,如果我在函数开始时更改kmeans质心的数量,然后重新运行所有内容,多边形看起来并不好看,这不是我最初希望的。我将继续更新以进行改进。