问题已经在评论中得到了解答。不过,我仍然在处理时区的问题。为了搞清楚它,我尝试了所有的组合。我认为您有两种主要方法,具体取决于您的日期时间对象是否已经在所需的时区内或处于不同的时区,我尝试在下面描述它们。可能我还错过了一些东西。
时间戳(日期时间对象):
在UTC中
期望显示:
在特定时区中
时间戳(日期时间对象):
在特定时区中
期望显示:
在不同的特定时区中
- 向绘图函数提供带有相应时区的日期时间对象(
tzinfo=)
- 将rcParams['timezone']设置为所需的显示时区
- 使用dateformatter(即使您对格式感到满意,格式化程序也具有时区感知性)
如果您正在使用plot_date(),您也可以传递tz关键字,但对于散点图,这是不可能的。
当您的源数据包含Unix时间戳时,请在使用matplotlib时区功能时明智地从
datetime.datetime.utcfromtimestamp()和不使用utc:
fromtimestamp()中进行选择。
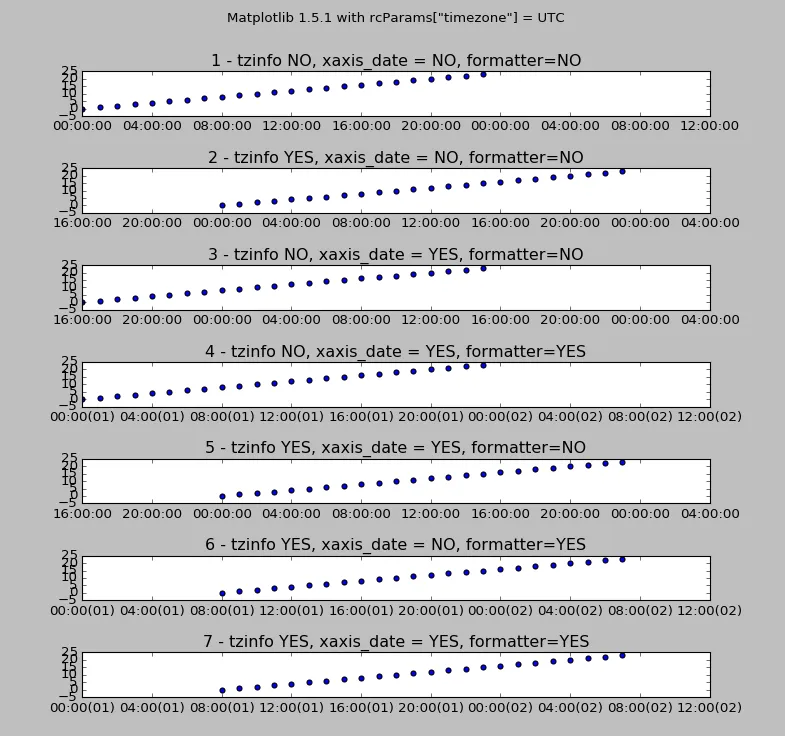
这是我所做的实验(在这种情况下是scatter()),可能有点难以理解,但只是为了写给任何关心这个问题的人。请注意第一批点出现的时间(每个子图的x轴起始时间不同):
源代码:
import time,datetime,matplotlib
import matplotlib.pyplot as plt
import numpy as np
import matplotlib.dates as mdates
from dateutil import tz
data = np.array([i for i in range(24)])
start = datetime.datetime.fromtimestamp(0)
start = datetime.datetime.utcfromtimestamp(0)
timestamps = np.array([start + datetime.timedelta(hours=i) for i in range(24)])
timestamps_tz = np.array([
start.replace(tzinfo=tz.gettz('US/Pacific')) + datetime.timedelta(hours=i)
for i in range(24)])
fig = plt.figure(figsize=(10.0, 15.0))
plt.subplot(711)
plt.scatter(timestamps, data)
plt.gca().set_xlim([datetime.datetime(1970,1,1), datetime.datetime(1970,1,2,12)])
plt.gca().set_title("1 - tzinfo NO, xaxis_date = NO, formatter=NO")
plt.subplot(712)
plt.scatter(timestamps_tz, data)
plt.gca().set_xlim([datetime.datetime(1970,1,1), datetime.datetime(1970,1,2,12)])
plt.gca().set_title("2 - tzinfo YES, xaxis_date = NO, formatter=NO")
plt.subplot(713)
plt.scatter(timestamps, data)
plt.gca().set_xlim([datetime.datetime(1970,1,1), datetime.datetime(1970,1,2,12)])
plt.gca().xaxis_date('US/Pacific')
plt.gca().set_title("3 - tzinfo NO, xaxis_date = YES, formatter=NO")
plt.subplot(714)
plt.scatter(timestamps, data)
plt.gca().set_xlim([datetime.datetime(1970,1,1), datetime.datetime(1970,1,2,12)])
plt.gca().xaxis_date('US/Pacific')
plt.gca().xaxis.set_major_formatter(mdates.DateFormatter('%H:%M(%d)'))
plt.gca().set_title("4 - tzinfo NO, xaxis_date = YES, formatter=YES")
plt.subplot(715)
plt.scatter(timestamps_tz, data)
plt.gca().set_xlim([datetime.datetime(1970,1,1), datetime.datetime(1970,1,2,12)])
plt.gca().xaxis_date('US/Pacific')
plt.gca().set_title("5 - tzinfo YES, xaxis_date = YES, formatter=NO")
plt.subplot(716)
plt.scatter(timestamps_tz, data)
plt.gca().set_xlim([datetime.datetime(1970,1,1), datetime.datetime(1970,1,2,12)])
plt.gca().set_title("6 - tzinfo YES, xaxis_date = NO, formatter=YES")
plt.gca().xaxis.set_major_formatter(mdates.DateFormatter('%H:%M(%d)'))
plt.subplot(717)
plt.scatter(timestamps_tz, data)
plt.gca().set_xlim([datetime.datetime(1970,1,1), datetime.datetime(1970,1,2,12)])
plt.gca().xaxis_date('US/Pacific')
plt.gca().set_title("7 - tzinfo YES, xaxis_date = YES, formatter=YES")
plt.gca().xaxis.set_major_formatter(mdates.DateFormatter('%H:%M(%d)'))
fig.tight_layout(pad=4)
plt.subplots_adjust(top=0.90)
plt.suptitle(
'Matplotlib {} with rcParams["timezone"] = {}, system timezone {}"
.format(matplotlib.__version__,matplotlib.rcParams["timezone"],time.tzname))
plt.show()

axes.xaxis_data(tz)会将所有要显示的日期设置为 那个 时区。如果您没有明确设置时区,它看起来会将时间转换为本地时区(我只是粗略浏览了代码,可能有偏差)。 - tacaswellscatter()绘制单个时间时,它会忽略时区(不会使用本地时区)...文档中的哪里存在“谎言”?我只看到缺乏有关显示时区的信息。 - Eric O. Lebigotaxes.xaxis_date(tz), 此方法的文档。 - sberder