leaflet插件和leaflet代理的polylineDecorator示例

5
请参考问题leaflet插件和leafletProxy
我想在R的leaflet中使用polylineDecorator插件
按照如何从R使用leaflet插件的说明,如果我使用leaflet()方法,就可以使用它。请参见第一个例子,它按照我想要的方式运作。但是,如果我尝试使用相同的方法与leafletProxy()一起使用,它就不会有任何效果,只会得到没有装饰器的线条。请参见第二个例子。
我的问题是如何使用R的leafletProxy()方法来使用leaflet插件。 示例1:可行版本,不使用leafletProxy。
library(shiny)
library(leaflet)
library(htmltools)

download.file(
          'https://raw.githubusercontent.com/bbecquet/Leaflet.PolylineDecorator/master/dist/leaflet.polylineDecorator.js', 
          'leaflet.polylineDecorator.js')

polylineDecoratorPlugin <- htmlDependency('Leaflet.PolylineDecorator',
                                          '1.6.0',
                      src = normalizePath('.'), 
                      script = 'leaflet.polylineDecorator.js')

registerPlugin <- function(map, plugin) {
  map$dependencies <- c(map$dependencies, list(plugin))
  map
}


ui <- bootstrapPage( 
            tags$style(type = "text/css", "html, body {width:100%;height:100%}"), 
            leafletOutput("map", width = "100%", height = "100%")
            )

server <- function(input, output) {
  dat <- data.frame(lat0=c(29,29.1),lat1=c(30,30.1), lng0=c(-96,-96.1),lng1=c(-95,-95.1))
  output$map <- renderLeaflet({
      m <- leaflet() %>%
#        addProviderTiles(providers$OpenStreetMap.BlackAndWhite) %>%
        setView(lat=29.762778, lng=-95.383056, zoom=8)  %>% # Houston
        registerPlugin(polylineDecoratorPlugin) %>%
        addPolylines(lat=c(dat$lat0[1], dat$lat1[1]), lng=c(dat$lng0[1],dat$lng1[1])) %>%
        addPolylines(lat=c(dat$lat0[2], dat$lat1[2]), lng=c(dat$lng0[2],dat$lng1[2])) %>%
        htmlwidgets::onRender("function(el,x,data) {
                            for(var i=0; i < data.lat0.length; i++) {
                              var dec = L.polylineDecorator([[data.lat0[i],data.lng0[i]],[data.lat1[i],data.lng1[i]]], {
                              patterns: [
                              {offset: 0, repeat: 20, symbol: L.Symbol.arrowHead({pixelSize:15, pathOptions:{stroke:true}})}
                              ]
                              }).addTo(this);
                            }
                            }",
                            data=dat)

  })
}

# Run the application 
shinyApp(ui = ui, server = server)

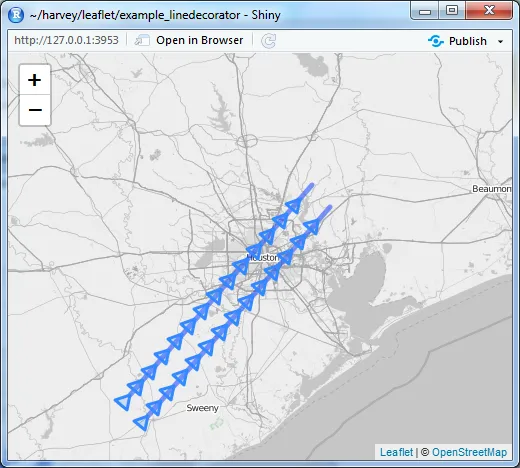
这是我从上面的代码中得到的结果,也是我期望的结果。

from the top code

示例2: 使用leafletProxy()方法,只显示线条而不显示装饰的版本:

library(shiny)
library(leaflet)
library(htmltools)

download.file(
          'https://raw.githubusercontent.com/bbecquet/Leaflet.PolylineDecorator/master/dist/leaflet.polylineDecorator.js', 
          'leaflet.polylineDecorator.js')

polylineDecoratorPlugin <- htmlDependency('Leaflet.PolylineDecorator',
                                          '1.6.0',
                      src = normalizePath('.'), 
                      script = 'leaflet.polylineDecorator.js')

registerPlugin <- function(map, plugin) {
  map$dependencies <- c(map$dependencies, list(plugin))
  map
}


ui <- bootstrapPage( 
            tags$style(type = "text/css", "html, body {width:100%;height:100%}"), 
            leafletOutput("map", width = "100%", height = "100%")
            )

server <- function(input, output) {
  dat <- data.frame(lat0=c(29,29.1),lat1=c(30,30.1), lng0=c(-96,-96.1),lng1=c(-95,-95.1))
  output$map <- renderLeaflet({
      m <- leaflet() %>%
#        addProviderTiles(providers$OpenStreetMap.BlackAndWhite) %>%
        setView(lat=29.762778, lng=-95.383056, zoom=8)  # Houston
    })
  observe({
    # THIS DOESNT WORK with PROXY!!!
    leafletProxy('map') %>%
    registerPlugin(polylineDecoratorPlugin) %>%
    addPolylines(lat=c(dat$lat0[1], dat$lat1[1]), lng=c(dat$lng0[1],dat$lng1[1])) %>%
    addPolylines(lat=c(dat$lat0[2], dat$lat1[2]), lng=c(dat$lng0[2],dat$lng1[2])) %>%
    htmlwidgets::onRender("function(el,x,data) {
                          for(var i=0; i < data.lat0.length; i++) {
                            var dec = L.polylineDecorator([[data.lat0[i],data.lng0[i]],[data.lat1[i],data.lng1[i]]], {
                            patterns: [
                            {offset: 0, repeat: 20, symbol: L.Symbol.arrowHead({pixelSize:15, pathOptions:{stroke:true}})}
                            ]
                            }).addTo(this);
                          }
                          }",
                          data=dat)
  })
}

# Run the application 
shinyApp(ui = ui, server = server)

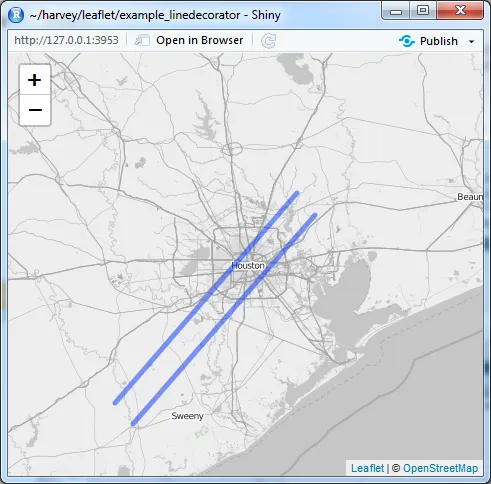
这里是示例2的结果。正如您所看到的,没有修饰符,只有线条,尽管我试图以几乎相同的方式使用htmlwidgets :: onRender

from the bottom code

1个回答

5

好的,我可能已经理解了。

我需要做的是:

  1. 使用leaflet而不是leafletProxy调用htmlwidgets::onRender。我必须预见在制作地图时会发生什么。

  2. 使用lealetProxy添加折线时,要自觉添加额外选项need_decorator=TRUE

  3. htmlwidgets::onRender的回调函数应该向地图添加事件监听器。在下面的代码中,这部分是: myMap.on('layeradd', function(e) {...} );。因此,装饰器将在添加图层时被添加。

  4. 我们想要将装饰器添加到折线上。所以我需要进行测试:if ('need_decorator' in lyr.options),以测试触发事件的图层是否是我想要添加装饰器的折线。如果没有这个测试,折线装饰器将触发事件并进入无限循环。

下面的示例代码生成了我想要的效果。对于有javascript经验的人来说,这可能是显而易见的,但像我这样的R用户对这种事件处理方式没有太多经验......

我想处理折线被修改/删除的情况,但我想法应该是相同的。

如果有更简单的方法,请告诉我。

library(shiny)
library(leaflet)
library(htmltools)

download.file(
  'https://raw.githubusercontent.com/bbecquet/Leaflet.PolylineDecorator/master/dist/leaflet.polylineDecorator.js', 
  'leaflet.polylineDecorator.js')

polylineDecoratorPlugin <- htmlDependency('Leaflet.PolylineDecorator',
                                          '1.6.0',
                                          src = normalizePath('.'), 
                                          script = 'leaflet.polylineDecorator.js')

registerPlugin <- function(map, plugin) {
  map$dependencies <- c(map$dependencies, list(plugin))
  map
}


ui <- bootstrapPage( 
  tags$style(type = "text/css", "html, body {width:100%;height:100%}"), 
  leafletOutput("map", width = "100%", height = "100%")
)

server <- function(input, output) {
  dat <- data.frame(lat0=c(29,29.1),lat1=c(30,30.1), lng0=c(-96,-96.1),lng1=c(-95,-95.1))
  output$map <- renderLeaflet({
    m <- leaflet() %>%
      registerPlugin(polylineDecoratorPlugin) %>%
      addProviderTiles(providers$CartoDB.Positron) %>%
      setView(lat=29.762778, lng=-95.383056, zoom=8) %>%  # Houston
      htmlwidgets::onRender(
        "function(el,x,data) {
          var myMap = this;

          // I have to wrap the decoration addition code with map.on() function
          // wait for polyline layer to be added before i add decorator    
          myMap.on('layeradd',
            function(e) {
              var lyr = e.layer;
              // among whatever layers added to the map, i look for
              // 'need_decorator' property which i tell myself to add as an options
              // when adding polyline
              if ('need_decorator' in lyr.options) {

                var dec = L.polylineDecorator(lyr, {
                  patterns: [
                    {offset: 0, repeat: 20, symbol: L.Symbol.arrowHead({pixelSize:15, pathOptions:{stroke:true}})}
                  ]
                }).addTo(myMap);
              }
            }
          );
        }",
      data=dat)
  })
  observe({
    leafletProxy('map') %>%
      # I am adding need_decorator = TRUE as an option.  This shows up as, when 
      # event got triggered, event.layer.options.need_decorator in Javascript
      addPolylines(lat=c(dat$lat0[1], dat$lat1[1]), lng=c(dat$lng0[1],dat$lng1[1]), options = list(need_decorator = T)) %>%
      addPolylines(lat=c(dat$lat0[2], dat$lat1[2]), lng=c(dat$lng0[2],dat$lng1[2]), options = list(need_decorator = T)) 

    })
  }

# Run the application 
shinyApp(ui = ui, server = server)

编辑 (2020-04-30) OpenStreetMap的提供者瓦片不再存在,所以我更换了CartoDB。已确认它仍在运作中。

演示


你搞定了吗?我正在尝试按照这种方法添加Leaflet.Spin插件,但对我来说不起作用。可能是Leaflet.Spin的问题。 - Simon Woodward
1
我尝试了一下,结果发现OpenStreetMap.BlackAndWhite已经不存在了,已经消失了。我改成了
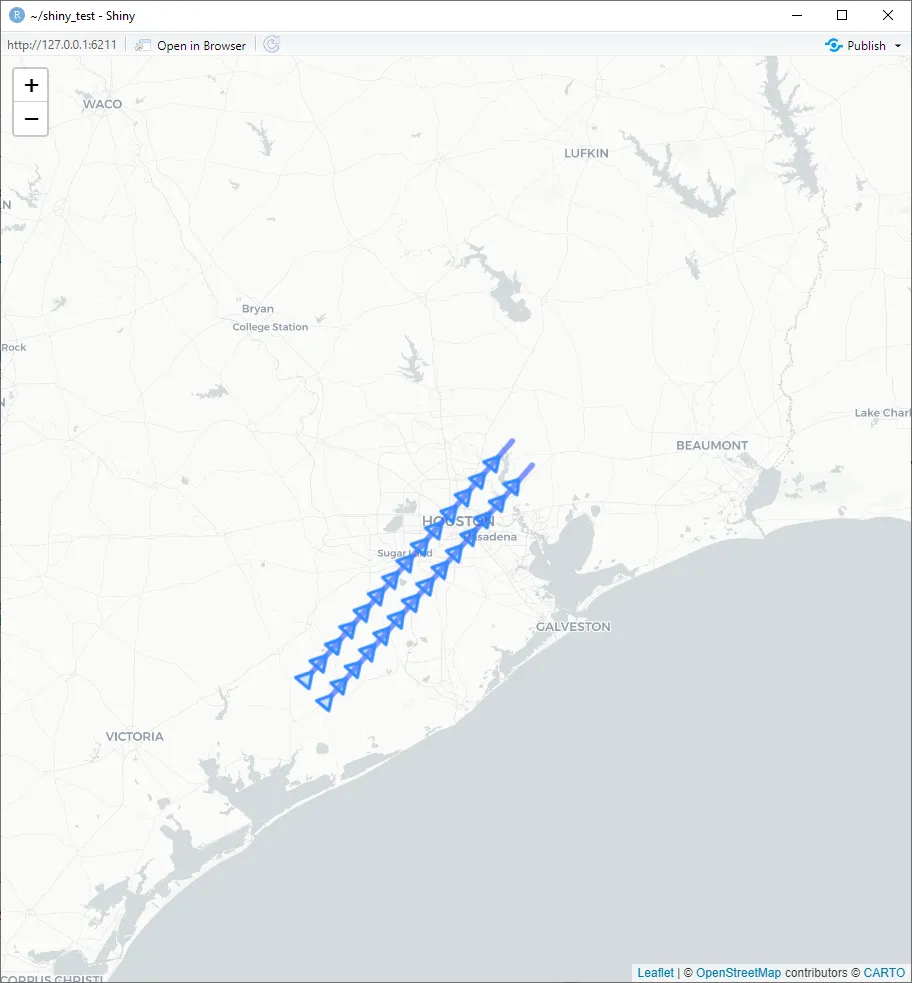
providers$CartoDB.Positron,现在它可以工作了。让我编辑一下代码。 - yosukesabai

网页内容由stack overflow 提供, 点击上面的
可以查看英文原文,
原文链接