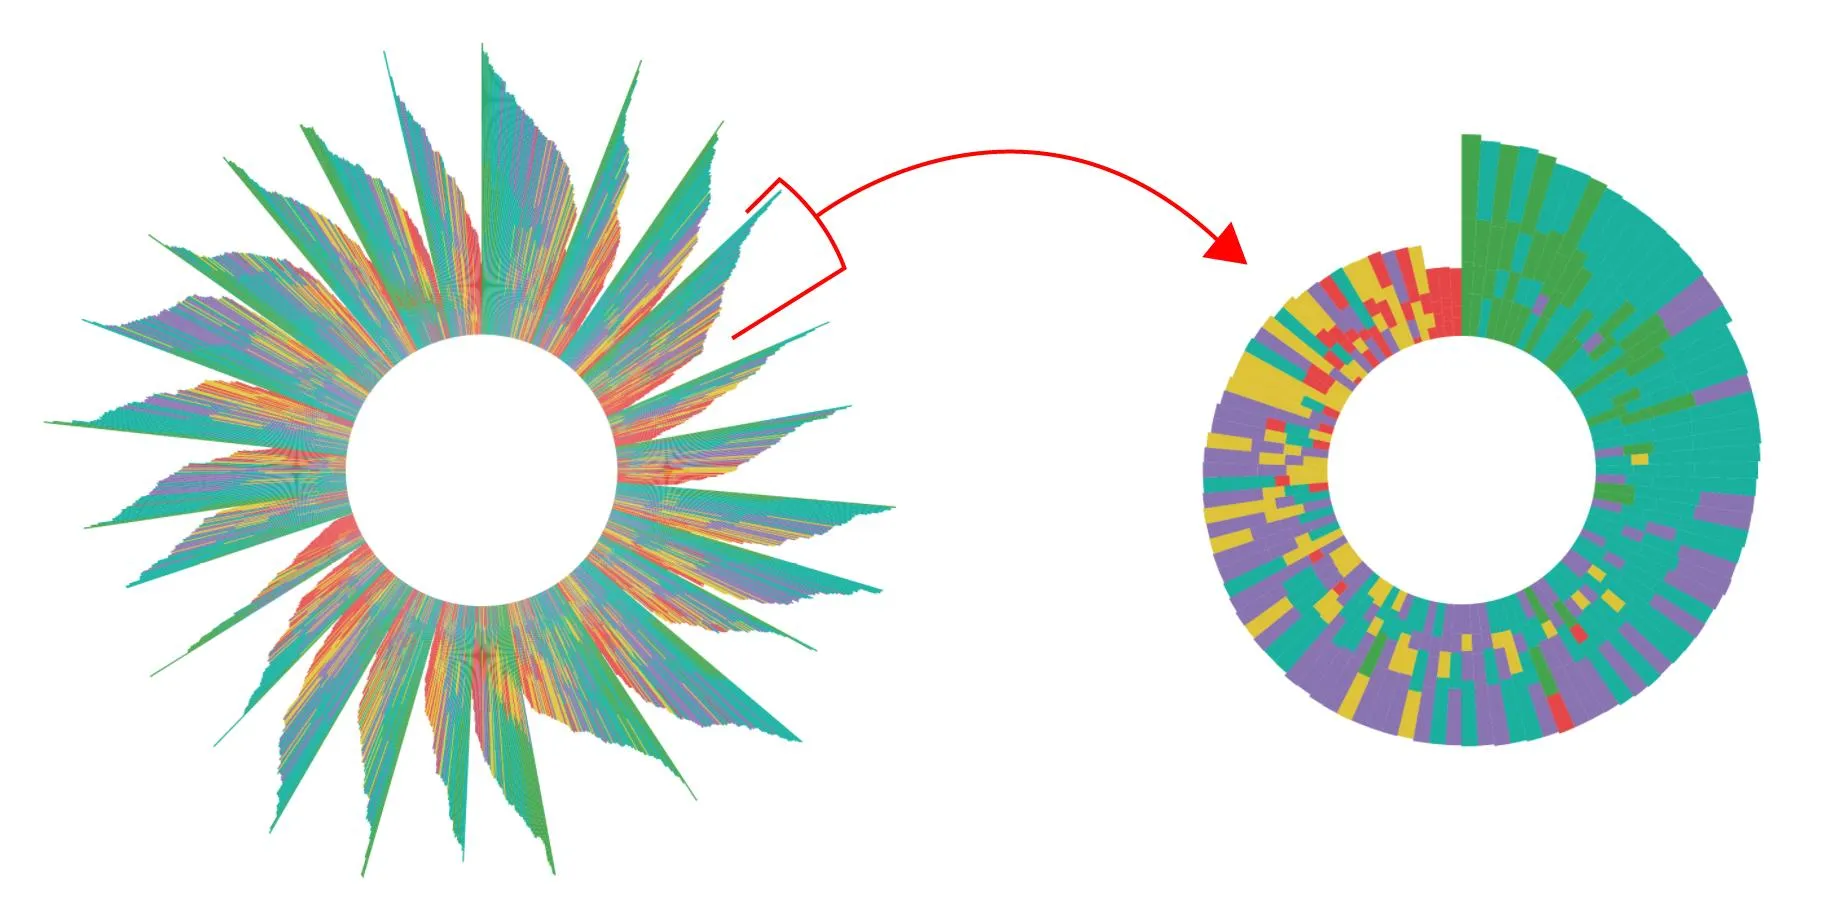
我在D3中制作了一个日出图表。每个“花瓣”表示数据的一个子集。当用户点击其中一个“花瓣”时,我希望它过渡并展开,仅显示该子集(参见图像):
我遇到了代码无法正确过渡的问题。
单击后,除所选内容外的所有“花瓣”应消失,并且剩余路径应沿圆圈进行动画处理(使用attrTween、arcTween和插值?)。主要更改的值是angleSize(var angleSize = (2 * Math.PI) / theData.length;)。
我尝试使用此链接、此链接、此链接和此链接作为参考,但并没有取得太多成功。最好的处理动画的方法是什么?
感谢您的时间!
--> 请查看此处的Plunker。<--
以下为代码:
  var colors = {
    'Rank1' : '#3FA548',
    'Rank2' : '#00B09E',
    'Rank3' : '#8971B3',
    'Rank4' : '#DFC423',
    'Rank5' : '#E74341'
  };

  var $container = $('.chart'),
      m = 40,
      width = $container.width() - m,
      height = $container.height() - m,
      r = Math.min(width, height) / 2;

  var study = null;
  var arc = d3.svg.arc();

  d3.csv('text.csv', ready);

  function ready(err, data) {
    if (err) console.warn('Error', err);

    var svg = d3.select('.chart')
                .append('svg')
                .attr({
                  'width' : (r + m) * 2,
                  'height' : (r + m) * 2,
                  'class' : 'container'
                })
                .append('g')
                .attr('transform', 'translate(' + (width / 4) + ', ' + (height / 2) + ' )');

    var slice = svg.selectAll('.slice');

    function updateChart(study) {
      if (study) {
        var theData = data.filter(function(d) {
              return d.study_name === study;
            });
      } else {
        var theData = data;
      }

      slice = slice.data(theData);

      slice.enter()
           .append('g')
           .attr('class', 'slice');

      var angleSize = (2 * Math.PI) / theData.length;

      var startRadArr = [],
          endRadArr = [];

      for ( var i = 0; i < data.length; i++ ) {
        var startRadius = (width / 20),
            endRadius = startRadius;

        for ( var x = 0; x < 4; x++ ) {
          startRadArr.push(startRadius);

          if ( x == 0 ) {
            endRadius += Number(data[i].group1_score) * (width / 500);
          } else if ( x == 1 ) {
            endRadius += Number(data[i].group2_score) * (width / 500);
          } else if ( x == 2 ) {
            endRadius += Number(data[i].group3_score) * (width / 500);
          } else {
            endRadius += Number(data[i].group4_score) * (width / 500);
          }

          endRadArr.push(endRadius);
          startRadius = endRadius + 0.3;
        }
      }

      var startRadGroup = [],
          endRadGroup = [];

      for (i = 0; i < startRadArr.length; i += 4) {
        startRadGroup.push(startRadArr.slice(i, i + 4));
      }

      for (i = 0; i < endRadArr.length; i += 4) {
        endRadGroup.push(endRadArr.slice(i, i + 4));
      }

      slice.selectAll('path')
           .remove();

      for ( var x = 0; x < 4; x++ ) {
        slice.append('path')
             .attr({
               'class' : function(d, i) {
                 if ( x == 0 ) {
                   return d.group1_class;
                 } else if ( x == 1 ) {
                   return d.group2_class;
                 } else if ( x == 2 ) {
                   return d.group3_class;
                 } else {
                   return d.group4_class;
                 }
               },
               'company' : function(d, i) {
                 return d.brand_name;
               },
               'cat' : function(d, i) {
                  if ( x == 0 ) {
                   return 'Group1';
                 } else if ( x == 1 ) {
                   return 'Group2';
                 } else if ( x == 2 ) {
                   return 'Group3';
                 } else {
                   return 'Group4';
                 }
               },
               'study' : function(d, i) {
                 return d.study_name;
               },
               'companyid' : function(d, i) {
                 return d.brand_id;
               },
               'startradius' : function(d, i) {
                 return startRadGroup[i][x];
               },
               'endradius' : function(d, i) {
                 return endRadGroup[i][x];
               },
               'startangle' : function(d, i) {
                 return angleSize * i;
               },
               'endangle' : function(d, i) {
                 return angleSize * (i + 1);
               }
             })
             .on('click', selectStudy);
      }

      slice.exit()
           .remove();

      slice.selectAll('path')
           .attr({
             'd' : function(d) {
                return arc({
                  innerRadius : +d3.select(this)[0][0].attributes.startradius.nodeValue,
                  outerRadius : +d3.select(this)[0][0].attributes.endradius.nodeValue,
                  startAngle : +d3.select(this)[0][0].attributes.startangle.nodeValue,
                  endAngle : +d3.select(this)[0][0].attributes.endangle.nodeValue
                })
              }
           });
    }

    function selectStudy(d) {
      study = $(this).attr('study');
      updateChart(study);
    }

    updateChart();
  }
编辑
根据 这个 来更新代码,使其包含一个正常工作的enter、update和exit模式。然而,对于转换仍有疑问。我链接的大部分示例使用类似于d3.interpolate(this._current, a);的方法,在不同数据之间进行补间处理。
在此图表中,this._current 和 a 是相同的,angleSize (var angleSize = (2 * Math.PI) / theData.length;)、startAngle 和 endAngle 是唯一变化的东西。