使用d3.js制作旋转地球和柱状图。

8

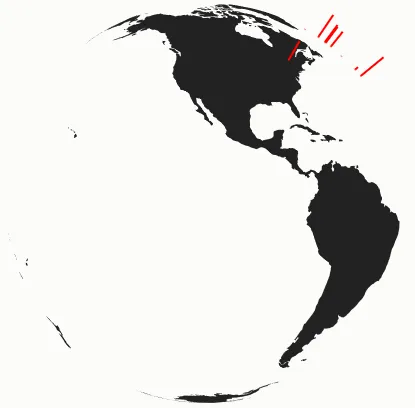
我想创建一个类似于这个例子中的带有条形图的旋转地球。你可以在这里看到我的示例。一切都进行得很顺利,直到条形图越过地平线。我不知道如何在它们位于地球另一侧时从底部削减条形图。有人能建议我如何做吗?

 /*
 * Original code source
 * http://codepen.io/teetteet/pen/Dgvfw
 */

var width = 400;
var height = 400;
var scrollSpeed = 50;
var current = 180;

var longitudeScale = d3.scale.linear()
  .domain([0, width])
  .range([-180, 180]);

var planetProjection = d3.geo.orthographic()
  .scale(200)
  .rotate([longitudeScale(current), 0])
  .translate([width / 2, height / 2])
  .clipAngle(90);
var barProjection = d3.geo.orthographic()
  .scale(200)
  .rotate([longitudeScale(current), 0])
  .translate([width / 2, height / 2])
  .clipAngle(90);

var path = d3.geo.path()
  .projection(planetProjection);

var svg = d3.select("body").append("svg")
  .attr("width", width)
  .attr("height", height);

d3.json("https://dl.dropboxusercontent.com/s/4hp49mvf7pa2cg2/world-110m.json?dl=1", function(error, world) {
  if (error) throw error;

  var planet = svg.append("path")
    .datum(topojson.feature(world, world.objects.land))
    .attr("class", "land")
    .attr("d", path);

  d3.csv("https://dl.dropboxusercontent.com/s/v4kn2hrnjlgx1np/data.csv?dl=1", function(error, data) {
    if (error) throw error;

    var max = d3.max(data, function(d) {
      return parseInt(d.Value);
    })

    var lengthScale = d3.scale.linear()
      .domain([0, max])
      .range([200, 250])

      var bars = svg.selectAll(".bar")
        .data(data)
        .enter()
        .append("line")
        .attr("class", "bar")
        .attr("stroke", "red")
        .attr("stroke-width", "2");

    function bgscroll() {

      current += 1;

      planetProjection.rotate([longitudeScale(current), 0]);
      barProjection.rotate([longitudeScale(current), 0]);

      planet.attr("d", path);

      bars.attr("x1", function(d) {
         return planetProjection([d.Longitude, d.Latitude])[0];
       }).attr("y1", function(d) {
         return planetProjection([d.Longitude, d.Latitude])[1];
       }).attr("x2", function(d) {
         barProjection.scale(lengthScale(d.Value));
         return barProjection([d.Longitude, d.Latitude])[0];
       }).attr("y2", function(d) {
         barProjection.scale(lengthScale(d.Value));
         return barProjection([d.Longitude, d.Latitude])[1];
       });
    }

//    bgscroll();
     setInterval(bgscroll, scrollSpeed);  
  })
})
4个回答

6
为了将地平线上的栏杆剪掉,我们在地球2D中心添加一个以其半径为半径的遮罩。然后,只有在底部边缘穿过地平线(通过跟踪经度)时才应用此遮罩。
创建遮罩:
// get the center of the circle
var center = planetProjection.translate();
// edge point
var edge = planetProjection([-90, 90])
// radius
var r = Math.pow(Math.pow(center[0] - edge[0], 2) + Math.pow(center[1] - edge[1], 2), 0.5);

svg.append("defs")
    .append("clipPath")
    .append("circle")
    .attr("id", "edgeCircle")
    .attr("cx", center[0])
    .attr("cy", center[1])
    .attr("r", r)

var mask = svg.append("mask").attr("id", "edge")
mask.append("rect")
    .attr("x", 0)
    .attr("y", 0)
    .attr("width", "100%")
    .attr("height", "100%")
    .attr("fill", "white");
mask.append("use")
    .attr("xlink:href", "#edgeCircle")
    .attr("fill", "black");

应用遮罩

.... bars ....
.attr("mask", function (d) {
    // make the range from 0 to 360, so that it's easier to compare
    var longitude = Number(d.Longitude) + 180;
    // +270 => -90 => the position of the left edge when the center is at 0
    // -value because a rotation to the right => left edge longitude is reducing
    // 360 because we want the range from 0 to 360
    var startLongitude = 360 - ((longitudeScale(current) + 270) % 360);
    // the right edge is start edge + 180
    var endLongitude = (startLongitude + 180) % 360;
    if ((startLongitude < endLongitude && longitude > startLongitude && longitude < endLongitude) ||
        // wrap around
        (startLongitude > endLongitude && (longitude > startLongitude || longitude < endLongitude)))
        return null;
    else
        return "url(#edge)";
});

我们也可以通过测量距离来实现这一点。
Fiddle - http://jsfiddle.net/gp3wvm8o/
enter image description here

1

只需跟踪可见经度范围,并在它们不在该范围内时隐藏条形图。

.attr("display", function(d) {
    // make the range from 0 to 360, so that it's easier to compare
    var longitude = Number(d.Longitude) + 180;
    // +270 => -90 => the position of the left edge when the center is at 0
    // -value because a rotation to the right => left edge longitude is reducing
    // 360 because we want the range from 0 to 360
    var startLongitude = 360 - ((longitudeScale(current) + 270) % 360);
    // the right edge is start edge + 180
    var endLongitude = (startLongitude + 180) % 360;
    if ((startLongitude < endLongitude && longitude > startLongitude && longitude < endLongitude) ||
        // wrap around
        (startLongitude > endLongitude && (longitude > startLongitude || longitude < endLongitude)))
        return "block";
    else
        return "none";
})

小提琴 - http://jsfiddle.net/b12ryhda/


谢谢。这是个好主意,但我不想一下子隐藏栏,而是逐渐隐藏,就像我在顶部提供的示例一样。 - zeleniy
@zeleniy - 我已经将其发布为单独的答案,因为核心部分本质上是不同的(显示 vs. 掩码)。 - potatopeelings

0

一个更简单的使用画布的方法是:

  1. 绘制所有的条形图而不进行裁剪
  2. 绘制地图
  3. 仅绘制前景条形图(即使用裁剪)

这种裁剪不必手动完成,可以利用 path.centroid 方法,该方法尊重由 clipAngle 设置在投影上的裁剪。伪代码可能如下所示:

let projection = d3.geoOrthographic()
               .clipAngle(90)
               ...
let barProjection = d3.geoOrthographic()
               .clipAngle(90)
               ...

let path = d3.geoPath()
         .projection(projection)
         .context(canvasCtx)
let barPath = d3.geoPath()
         .projection(barProjection)

let renderBar = function(isBgLayer = false) {
    let barLengthAsScale = ...
    barProjection.scale(barLengthAsScale)
    let barStart, barEnd
    if (isBgLayer) {
        barStart = projection([ lon, lat ])
        barEnd = barProjection([ lon, lat ])
    } else {
        let geoJs = { type: 'Point', coordinates: [ lon, lat ] }
        barStart = path.centroid(geoJs)
        barEnd = barPath.centroid(geoJs)
    }
    // draw line from start to end using canvasCtx
};

let renderMap = function(topology) {
    // normal map drawing to canvas
};

// then to render a frame
renderBar(true)
renderMap(topoJsonTopology)
renderBar()

有些条形图会被绘制两次,但我发现画布足够快,可以跟上绘制并保持至少200个条形图的动画流畅。

例如,请查看这个GitHub上的代码实时页面


0

我以前做过很多次,然后忘记了,最近在JSFiffle这里找到了一个可行的例子。

/*
 * Based on http://codepen.io/teetteet/pen/Dgvfw
 */
var width = 400;
var height = 400;
var scrollSpeed = 50;
var current = 180;

var longitudeScale = d3.scale.linear()
  .domain([0, width])
  .range([-180, 180]);

var planetProjection = d3.geo.orthographic()
  .scale(200)
  .rotate([longitudeScale(current), 0])
  .translate([width / 2, height / 2])
  .clipAngle(90);
var barProjection = d3.geo.orthographic()
  .scale(200)
  .rotate([longitudeScale(current), 0])
  .translate([width / 2, height / 2])
  .clipAngle(90);

var path = d3.geo.path()
  .projection(planetProjection);

var svg = d3.select("body").append("svg")
  .attr("width", width)
  .attr("height", height);

// mask creation
var center = planetProjection.translate();   // get the center of the circle
var edge = planetProjection([-90, 90]); // edge point 
var r = Math.pow(Math.pow(center[0] - edge[0], 2) + Math.pow(center[1] - edge[1], 2), 0.5); // radius

svg.append("defs")
    .append("clipPath")
    .append("circle")
    .attr("id", "edgeCircle")
    .attr("cx", center[0])
    .attr("cy", center[1])
    .attr("r", r)
var mask = svg.append("mask").attr("id", "edge")
mask.append("rect")
    .attr("x", 0)
    .attr("y", 0)
    .attr("width", "100%")
    .attr("height", "100%")
    .attr("fill", "white");
mask.append("use")
    .attr("xlink:href", "#edgeCircle")
    .attr("fill", "black");

d3.json("https://unpkg.com/world-atlas@1.1.4/world/110m.json", function(error, world) {
  if (error) throw error;

  var planet = svg.append("path")
    .datum(topojson.feature(world, world.objects.land))
    .attr("class", "land")
    .attr("d", path);

  d3.csv("https://dl.dropboxusercontent.com/s/3tseu6lxyl715pt/cities.csv?dl=1", function(error, data) {
    if (error) throw error;

    var max = d3.max(data, function(d) {
      return parseInt(d.Value);
    })

    var lengthScale = d3.scale.linear()
      .domain([0, max])
      .range([200, 250])

      var bars = svg.selectAll(".bar")
        .data(data)
        .enter()
        .append("line")
        .attr("class", "bar")
        .attr("stroke", "red")
        .attr("stroke-width", "2");

    function bgscroll() {

      current += 1;

      planetProjection.rotate([longitudeScale(current), 0]);
      barProjection.rotate([longitudeScale(current), 0]);

      planet.attr("d", path);

      bars.attr("x1", function(d) {
         return planetProjection([d.Longitude, d.Latitude])[0];
       }).attr("y1", function(d) {
         return planetProjection([d.Longitude, d.Latitude])[1];
       }).attr("x2", function(d) {
         barProjection.scale(lengthScale(d.Value));
         return barProjection([d.Longitude, d.Latitude])[0];
       }).attr("y2", function(d) {
         barProjection.scale(lengthScale(d.Value));
         return barProjection([d.Longitude, d.Latitude])[1];
       }).attr("mask", function (d) {
        // make the range from 0 to 360, so that it's easier to compare
        var longitude = Number(d.Longitude) + 180;
        // +270 => -90 => the position of the left edge when the center is at 0
        // -value because a rotation to the right => left edge longitude is reducing
        // 360 because we want the range from 0 to 360
        var startLongitude = 360 - ((longitudeScale(current) + 270) % 360);
        // the right edge is start edge + 180
        var endLongitude = (startLongitude + 180) % 360;
        if ((startLongitude < endLongitude && longitude > startLongitude && longitude < endLongitude) ||
            // wrap around
            (startLongitude > endLongitude && (longitude > startLongitude || longitude < endLongitude)))
            return null;
        else
            return "url(#edge)";
    });
    }

//    bgscroll();
     setInterval(bgscroll, scrollSpeed);  
  })
})
body {
  background: #fcfcfa;
}
.stroke {
  fill: none;
  stroke: #000;
  stroke-width: 3px;
}
.fill {
  fill: #fff;
}
.graticule {
  fill: none;
  stroke: #777;
  stroke-width: .5px;
  stroke-opacity: .5;
}
.land {
  fill: #222;
}

.boundary {
  fill: none;
  stroke: #fff;
  stroke-width: .5px;
}
<script src="https://cdnjs.cloudflare.com/ajax/libs/topojson/3.0.2/topojson.min.js"></script>
<script src="https://cdnjs.cloudflare.com/ajax/libs/d3/3.5.17/d3.min.js"></script>


网页内容由stack overflow 提供, 点击上面的
可以查看英文原文,
原文链接