如何为带有文本的矩形模拟拖动

5

我希望将每个表格行矩形的形式拖动,它必须具有与矩形相同的功能。

一旦运行代码,您可以在下方看到一个表格,在左上角会有矩形,我想为表格行拖动复制相同的功能。

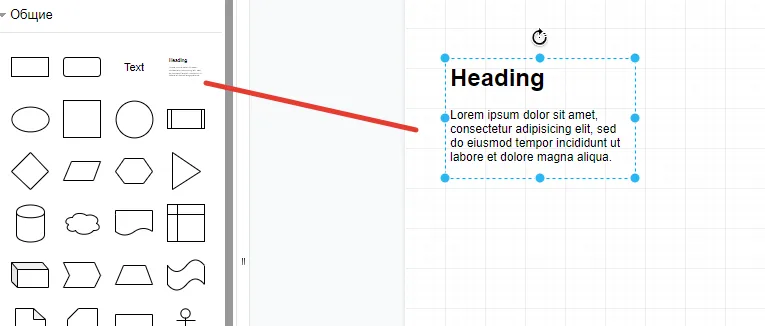
问题:当我将表格行拖动到下面的图形区域时,它应该被视为矩形拖动。类似于图形区域左上角矩形拖动旁边的。

我正在使用(文档):https://jgraph.github.io/mxgraph/docs/manual.html

完整视图请参见Codepen:https://codepen.io/eabangalore/pen/vMvdmZ

视频将展示我的问题:https://drive.google.com/file/d/1DR3qMxX8JViSwMbA5vWYhMeMgRlQ0Krs/view

// Program starts here. Creates a sample graph in the
// DOM node with the specified ID. This function is invoked
// from the onLoad event handler of the document (see below).
function main() {
  // Checks if browser is supported
  if (!mxClient.isBrowserSupported()) {
    // Displays an error message if the browser is
    // not supported.
    mxUtils.error('Browser is not supported!', 200, false);
  } else {
    // Defines an icon for creating new connections in the connection handler.
    // This will automatically disable the highlighting of the source vertex.
    mxConnectionHandler.prototype.connectImage = new mxImage('images/connector.gif', 16, 16);

    // Creates the div for the toolbar
    var tbContainer = document.createElement('div');
    tbContainer.style.position = 'absolute';
    tbContainer.style.overflow = 'hidden';
    tbContainer.style.padding = '2px';
    tbContainer.style.left = '0px';
    tbContainer.style.top = '0px';
    tbContainer.style.width = '24px';
    tbContainer.style.bottom = '0px';

    document.body.appendChild(tbContainer);

    // Creates new toolbar without event processing
    var toolbar = new mxToolbar(tbContainer);
    toolbar.enabled = false

    // Creates the div for the graph
    var container = document.createElement('div');
    container.style.position = 'absolute';
    container.style.overflow = 'hidden';
    container.style.left = '24px';
    container.style.top = '0px';
    container.style.right = '0px';
    container.style.bottom = '0px';
    container.style.background = 'url("https://jgraph.github.io/mxgraph/javascript/examples/editors/images/grid.gif")';
    //document.getElementById('graph-wrapper').style.background = 'url("editors/images/grid.gif")';

    document.getElementById('graph-wrapper').appendChild(container);

    // Workaround for Internet Explorer ignoring certain styles
    if (mxClient.IS_QUIRKS) {
      document.body.style.overflow = 'hidden';
      new mxDivResizer(tbContainer);
      new mxDivResizer(container);
    }

    // Creates the model and the graph inside the container
    // using the fastest rendering available on the browser
    var model = new mxGraphModel();
    var graph = new mxGraph(container, model);

    // Enables new connections in the graph
    graph.setConnectable(true);
    graph.setMultigraph(false);

    // Stops editing on enter or escape keypress
    var keyHandler = new mxKeyHandler(graph);
    var rubberband = new mxRubberband(graph);

    var addVertex = function(icon, w, h, style) {
      var vertex = new mxCell(null, new mxGeometry(0, 0, w, h), style);
      vertex.setVertex(true);

      console.log('vertex vertex', vertex);

      var img = addToolbarItem(graph, toolbar, vertex, icon);
      //img.enabled = true;

      graph.getSelectionModel().addListener(mxEvent.CHANGE, function() {
        var tmp = graph.isSelectionEmpty();
        mxUtils.setOpacity(img, (tmp) ? 100 : 20);
        img.enabled = tmp;
      });
    };

    addVertex('https://jgraph.github.io/mxgraph/javascript/examples/editors/images/rounded.gif', 100, 40, 'shape=rounded');
  }
}

function addToolbarItem(graph, toolbar, prototype, image) {
  // Function that is executed when the image is dropped on
  // the graph. The cell argument points to the cell under
  // the mousepointer if there is one.
  var funct = function(graph, evt, cell, x, y) {
    graph.stopEditing(false);

    var vertex = graph.getModel().cloneCell(prototype);
    vertex.geometry.x = x;
    vertex.geometry.y = y;

    graph.addCell(vertex);
    graph.setSelectionCell(vertex);
  }

  // Creates the image which is used as the drag icon (preview)
  var img = toolbar.addMode(null, image, function(evt, cell) {
    var pt = this.graph.getPointForEvent(evt);
    funct(graph, evt, cell, pt.x, pt.y);
  });

  // Disables dragging if element is disabled. This is a workaround
  // for wrong event order in IE. Following is a dummy listener that
  // is invoked as the last listener in IE.
  mxEvent.addListener(img, 'mousedown', function(evt) {
    // do nothing
  });

  // This listener is always called first before any other listener
  // in all browsers.
  mxEvent.addListener(img, 'mousedown', function(evt) {
    if (img.enabled == false) {
      mxEvent.consume(evt);
    }
  });

  mxUtils.makeDraggable(img, graph, funct);

  return img;
}

<
/script> <
/head>

<!-- Calls the main function after the page has loaded. Container is dynamically created. -->
<
body onload = "main();" >
  <
  div class = "table-wrapper" >
  <
  table >
  <
  tr draggable = "true"
ondragstart = "importDragHandler(event)" >
  <
  th > Company < /th> <
  th > Contact < /th> <
  th > Country < /th> <
  /tr> <
  tr draggable = "true"
ondragstart = "importDragHandler(event)" >
  <
  td > Alfreds Futterkiste < /td> <
  td > Maria Anders < /td> <
  td > Germany < /td> <
  /tr> <
  tr draggable = "true"
ondragstart = "importDragHandler(event)" >
  <
  td > Centro comercial Moctezuma < /td> <
  td > Francisco Chang < /td> <
  td > Mexico < /td> <
  /tr>

  <
  /table> <
  /div> <
  div id = "graph-wrapper" >

  <
  /div> <
  script >

  function importDragHandler(event) {
    console.log('event..........', event);
    var elem = document.createElement("div");
    elem.innerHTML = "";
    elem.id = "import_handler_drag_ghost";
    elem.textNode = "Dragging";
    // elem.style.position = "absolute";
    elem.style.top = "-1000px";
    document.body.appendChild(elem);
    event.dataTransfer.setDragImage(elem, 0, 0);
  }

document.addEventListener("dragend", function(e) {
  var ghost = document.getElementById("import_handler_drag_ghost");
  if (ghost.parentNode) {
    //ghost.parentNode.removeChild(ghost);
    $('#import_handler_drag_ghost').fadeOut(3000, function() {
      $('#import_handler_drag_ghost').remove();
    });
  }

}, false);
table {
  font-family: arial, sans-serif;
  border-collapse: collapse;
  width: 100%;
}

td,
th {
  border: 1px solid #dddddd;
  text-align: left;
  padding: 8px;
}

tr:nth-child(even) {
  background-color: #dddddd;
}

body {
  height: 900px;
}

div:last-child {
  position: absolute;
  overflow: hidden;
  left: 10px !important;
  top: 264px !important;
  border: 1px solid #dedede;
  background: #e5e5e5;
  //padding: 32px;
  height: 100%;
}

#import_handler_drag_ghost {
  width: 90px !important;
  height: 25px !important;
  border: 2px solid;
  background: #fff;
  padding: 0px !important;
}

#graph-wrapper {
  height: 500px;
}
<script src="https://cdnjs.cloudflare.com/ajax/libs/jquery/3.3.1/jquery.min.js"></script>
<script type="text/javascript">
  mxBasePath = 'https://jgraph.github.io/mxgraph/javascript/src';
</script>
<script src="https://jgraph.github.io/mxgraph/javascript/src/js/mxClient.js"></script>

请帮助我,提前感谢!!!

不太清楚,请解释得更详细一些,您所说的“模拟”是什么意思?您想要什么输出结果? - Shoyeb Sheikh
矩形拖动应该适用于文本,仅此而已。 - user6783030
您想通过点击/拖动来调整或移动文本吗? - apocalysque
如果我拖动文本,则应出现“矩形”,并且必须模拟“矩形拖动”。 - user6783030
我仍然无法解决。请帮帮我。我的问题很简单。如果从“侧边栏”中“拖动”了“文本”,则应将其视为固定大小的“矩形”。 - user6783030
显示剩余2条评论
2个回答

2
你好。
1.首先,您不能仅添加元素。
最初的回答:Good Day.
1.首先,您不能仅添加元素。
setTimeout(function(){
     var html = '<div class="simulate"><p>Simulate Above Rect Drag</p></div><div 
     class="simulate"><p>Simulate Above Rect Drag</p></div>';
    $('.geSidebarContainer').append(html);
},3500);

使用自己的JavaScript事件处理程序实现拖动机制!

Draw.io使用自己的机制来侧边栏和从侧边栏拖动元素!

如果您不想硬编码(并陷入draw.io代码库中),最好使用Draw.io实现的机制

2.在Sidebar.js中,您可以添加自己的调色板

注:Original Answer翻译成“最初的回答”

Sidebar.prototype.init = function()
{
    var dir = STENCIL_PATH;

    this.addSearchPalette(true);
    this.addFalconPalette(true);   //Thats my pallete
    .......
}

3. 添加你的调色板代码 在这段代码中,你可以实现任何你想要的自定义元素!

Sidebar.prototype.addFalconPalette = function(expand)
{

    // Avoids having to bind all functions to "this"
    var sb = this;

    // Reusable cells
    var field = new mxCell('+ field: type', new mxGeometry(0, 0, 100, 26), 'text;strokeColor=none;fillColor=none;align=left;verticalAlign=top;spacingLeft=4;spacingRight=4;overflow=hidden;rotatable=0;points=[[0,0.5],[1,0.5]];portConstraint=eastwest;');
    field.vertex = true;

    var divider = new mxCell('', new mxGeometry(0, 0, 40, 8), 'line;strokeWidth=1;fillColor=none;align=left;verticalAlign=middle;spacingTop=-1;spacingLeft=3;spacingRight=3;rotatable=0;labelPosition=right;points=[];portConstraint=eastwest;');
    divider.vertex = true;

    var w = 50;     var h = 50;

    var s = 'shape=mxgraph.bpmn.shape;html=1;verticalLabelPosition=bottom;labelBackgroundColor=#ffffff;verticalAlign=top;align=center;perimeter=ellipsePerimeter;outlineConnect=0;';
    var dt = 'Falcon';

    var s2 = 'shape=mxgraph.bpmn.shape;html=1;verticalLabelPosition=bottom;labelBackgroundColor=#ffffff;verticalAlign=top;align=center;perimeter=rhombusPerimeter;background=gateway;outlineConnect=0;';
    //default tags
    var dt2 = 'bpmn business process model gateway '; 


    var fns = [
        this.createVertexTemplateEntry(s + 'outline=standard;symbol=general;', w, h, getxml("StartEvent",1), 'StartEvent', null, null, dt + 'general start'),
        this.createVertexTemplateEntry(s + 'outline=end;symbol=general;', w, h, getxml("EndEvent",1), 'EndEvent', null, null, dt + 'general end'),

        this.addEntry(this.getTagsForStencil('mxgraph.bpmn', 'user_task').join(' '), function()
        {
            var cell = new mxCell(getxml("UserTask"), new mxGeometry(0, 0, 120, 80), 'html=1;whiteSpace=wrap;rounded=1;');
            cell.vertex = true;

            // var cell1 = new mxCell('', new mxGeometry(0, 0, 14, 14), 'html=1;shape=mxgraph.bpmn.user_task;outlineConnect=0;');
            // cell1.vertex = true;
            // cell1.geometry.relative = true;
            // cell1.geometry.offset = new mxPoint(7, 7);
            // cell.insert(cell1);

            return sb.createVertexTemplateFromCells([cell], cell.geometry.width, cell.geometry.height, 'User Task');
        }),

        this.createVertexTemplateEntry(s2 + 'outline=none;symbol=exclusiveGw;', w, h, getxml("ExclusiveGateway",1), 'Exclusive Gateway', null, null, dt2 + 'exclusive'),
        this.createVertexTemplateEntry(s2 + 'outline=none;symbol=parallelGw;', w, h, getxml("ParallelGateway",1), 'Parallel Gateway', null, null, dt2 + 'parallel'),
    ];

    this.addPaletteFunctions('bpmnEvents', mxResources.get('falcon'), expand || false, fns);
};

4. 不需要重新实现侧边栏的拖动机制。你只需要了解侧边栏的工作原理!

5. 最好克隆Draw.io存储库!https://github.com/jgraph/drawio查看addGeneralPalette,那里已经有自定义文本元素了!

Sidebar.prototype.addGeneralPalette = function(expand)
{
    //return false;
    var lineTags = 'line lines connector connectors connection connections arrow arrows ';

    var fns = [
        this.createVertexTemplateEntry('rounded=0;whiteSpace=wrap;html=1;', 120, 60, '', 'Rectangle', null, null, 'rect rectangle box'),
        this.createVertexTemplateEntry('rounded=1;whiteSpace=wrap;html=1;', 120, 60, '', 'Rounded Rectangle', null, null, 'rounded rect rectangle box'),
        // Explicit strokecolor/fillcolor=none is a workaround to maintain transparent background regardless of current style
        this.createVertexTemplateEntry('text;html=1;strokeColor=none;fillColor=none;align=center;verticalAlign=middle;whiteSpace=wrap;rounded=0;',
            40, 20, 'Text', 'Text', null, null, 'text textbox textarea label'),
        this.createVertexTemplateEntry('text;html=1;strokeColor=none;fillColor=none;spacing=5;spacingTop=-20;whiteSpace=wrap;overflow=hidden;rounded=0;', 190, 120,
            '<h1>Heading</h1><p>Lorem ipsum dolor sit amet, consectetur adipisicing elit, sed do eiusmod tempor incididunt ut labore et dolore magna aliqua.</p>',
            'Textbox', null, null, 'text textbox textarea'),

enter image description here


目前正在实现自己的Bpmn设计器!基于draw.io。 - Diaskhan
很好,但我希望文本被包裹在边框内,即用“矩形”将“文本”包围起来。你展示了带有“Lorem Ipsum”文本的“标题”,但它没有被“边框”包围。我的期望非常简单:我不想在“侧边栏”中看到任何形状,而是希望“文本”在被“拖入容器”时变成“矩形”。 - user6783030
没关系,因为在mxGraph中有两种可能的对象。边缘和顶点。所有其他的东西都是通过样式对象来制作的!标签样式! - Diaskhan
你需要使用https://jqueryui.com/draggable,在拖动事件被触发后,必须调用以下代码: var v1 = graph.insertVertex(parent, null, 'Hello,', 20, 20, 80, 30);。希望能对你有所帮助! - Diaskhan
请点击此处 https://stackoverflow.com/questions/34608701/drag-and-drop-with-the-help-of-jquery,了解如何使用jQuery实现拖放功能。 - Diaskhan
显示剩余4条评论

1
你走在正确的道路上。在拖放事件处理程序中创建顶点对象,并用表格数据填充它。
所以对于可拖动的表格行:<tr draggable="true" ondragstart="drag(event)">...</tr> 给容器(网格)一个ID,这样你以后可以找到它,并添加dragoverdrop事件处理程序:
// Creates the div for the graph
var container = document.createElement("div");   
container.id = "grid" // an ID so we can find it later
container.style.position = "absolute";
// etc...

container.addEventListener("dragover", function(event) {
  event.preventDefault();
});

container.addEventListener("drop", function(event) {
  drop(event);
});

...

function drag(ev) {
  ev.dataTransfer.setData("text", ev.target.innerText); // save whatever text you want here
}

function drop(ev) {
  ev.preventDefault();

  var data = ev.dataTransfer.getData("text");

  // Gets the default parent for inserting new cells. This
  // is normally the first child of the root (ie. layer 0).
  var parent = graph.getDefaultParent();
  graph.getModel().beginUpdate();

  var gridRect = $('#grid')[0].getBoundingClientRect();
  var targetX = ev.x - gridRect.x;
  var targetY = ev.y - gridRect.y;

  try {
    var v1 = graph.insertVertex(parent, null, data, targetX, targetY, 300, 30);
  } finally {
    // Updates the display
    graph.getModel().endUpdate();
  }
}

作为一个附带说明,为了将targetXtargetY值调整到最近的网格间距上,可以添加捕捉网格功能。
Codepen: 拖放表格行

我所做的另一个更改是将 graph 设为全局对象,以便稍后可以引用它。 - K Scandrett
在Firefox中测试过 - K Scandrett
非常感谢您的帮助,请查看我在stack overflow上的这个问题:https://stackoverflow.com/questions/55835272/how-to-retain-drawn-boxes-and-path-on-page-refresh-mxgraph - user6783030

网页内容由stack overflow 提供, 点击上面的
可以查看英文原文,
原文链接