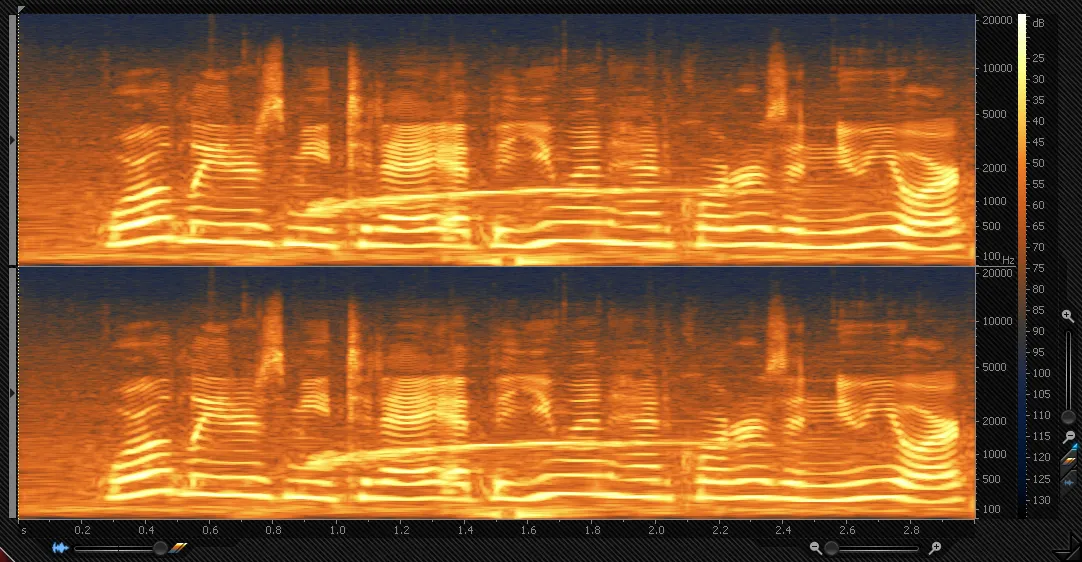
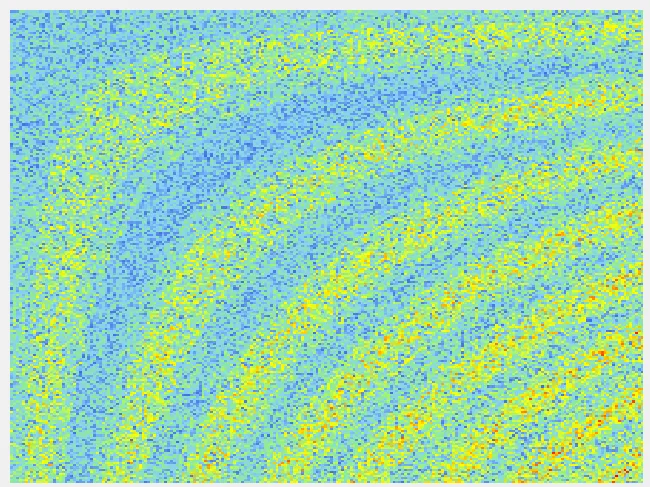
使用短时傅里叶变换(STFT)后,输出的是一个代表三维图形的矩阵,如下所示:
Spectrogram 2
如何在C#中使用渐变颜色绘制输出矩阵A,就像示例中的图片一样?是否有包含C#谱图控件的库?
更新:
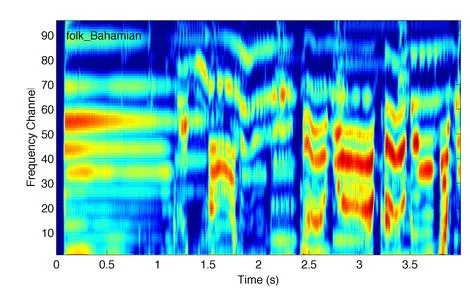
通过对给定算法进行一些修改,我可以绘制出谱图。我没有改变颜色调色板,除了将第一种颜色更改为黑色,但我不知道为什么它非常模糊!
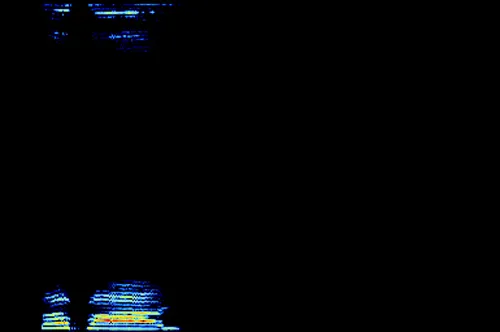
这个表示一个声音说“再见”:
Bye Bye Spectrogram
这是一个
Pure sine wave Spectrogram
输出被接受,它表示输入信号的频率,但我认为有一种方法可以使谱图像示例中的那些一样好地呈现出来,请帮忙检查我的代码并提出修改建议。
以下是事件处理程序:
(A[X, Y] = M),其中A是输出矩阵,X表示时间,Y表示频率,第三维M表示振幅,用像素颜色的强度表示。以下图片是示例:Spectrogram 2
如何在C#中使用渐变颜色绘制输出矩阵A,就像示例中的图片一样?是否有包含C#谱图控件的库?
更新:
通过对给定算法进行一些修改,我可以绘制出谱图。我没有改变颜色调色板,除了将第一种颜色更改为黑色,但我不知道为什么它非常模糊!
这个表示一个声音说“再见”:
Bye Bye Spectrogram
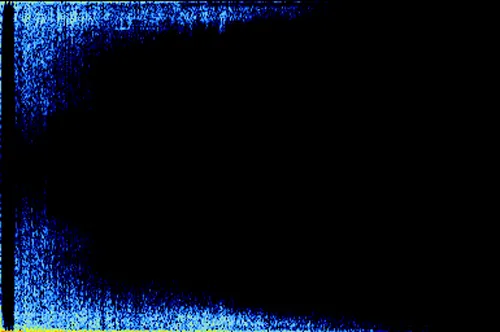
这是一个
纯正的正弦波,所以它几乎一直是相同的频率:Pure sine wave Spectrogram
输出被接受,它表示输入信号的频率,但我认为有一种方法可以使谱图像示例中的那些一样好地呈现出来,请帮忙检查我的代码并提出修改建议。
以下是事件处理程序:
private void SpectrogramButton_Click(object sender, EventArgs e)
{
    Complex[][] SpectrogramData = Fourier_Transform.STFT(/*signal:*/ samples,  /*windowSize:*/ 512, /*hopSize:*/ 512);
    SpectrogramBox.Image = Spectrogram.DrawSpectrogram(SpectrogramData, /*Interpolation Factor:*/ 1000, /*Height:*/ 256);
}
这是我的修改后的绘图功能:
public static Bitmap DrawSpectrogram(Complex[][] Data, int InterpolationFactor, int Height)
{
    // target size:
    Size sz = new Size(Data.GetLength(0), Height);
    Bitmap bmp = new Bitmap(sz.Width, sz.Height);

    // the data array:
    //double[,] data = new double[222, 222];

    // step sizes:
    float stepX = 1f * sz.Width / Data.GetLength(0);
    float stepY = 1f * sz.Height / Data[0].GetLength(0);

    // create a few stop colors:
    List<Color> baseColors = new List<Color>();  // create a color list
    baseColors.Add(Color.Black);
    baseColors.Add(Color.LightSkyBlue);
    baseColors.Add(Color.LightGreen);
    baseColors.Add(Color.Yellow);
    baseColors.Add(Color.Orange);
    baseColors.Add(Color.Red);


    // and the interpolate a larger number of grdient colors:
    List<Color> colors = interpolateColors(baseColors, InterpolationFactor);

    // a few boring test data
    //Random rnd = new Random(1);
    //for (int x = 0; x < data.GetLength(0); x++)
    //    for (int y = 0; y < data.GetLength(1); y++)
    //    {
    //        //data[x, y] = rnd.Next((int)(300 + Math.Sin(x * y / 999) * 200)) +
    //        //                rnd.Next(x + y + 111);
    //        data[x, y] = 0;
    //    }

    // now draw the data:
    float Max = Complex.Max(Data);
    using (Graphics G = Graphics.FromImage(bmp))
        for (int x = 0; x < Data.GetLength(0); x++)
            for (int y = 0; y < Data[0].GetLength(0); y++)
            {
                int Val = (int)Math.Ceiling((Data[x][y].Magnitude / Max) * (InterpolationFactor - 1));
                using (SolidBrush brush = new SolidBrush(colors[(int)Val]))
                    G.FillRectangle(brush, x * stepX, (Data[0].GetLength(0) - y) * stepY, stepX, stepY);
            }

    // and display the result
    return bmp;
}
很抱歉,我对你在回答中提到的“log”一事并不太理解,我的知识有限。
更新:
这是加入log10对幅度进行计算后的输出结果(忽略负值):
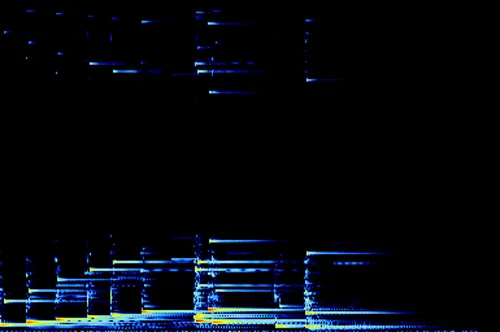
我认为这个输出结果是可以接受的,虽然不同于我之前提供的例子,但我认为它更好。
fr = sampleRate / # samples,然后通过方程式f = n * fr计算索引或行n的频率值f。正如你所看到的,它与采样速率和样本数有关,这些参数因文件而异,我不确定它是否正确,但没有尝试过。 - Mohamed HosnieComplex [] [] SpectrogramData)存储起来,还是总是重新计算它们?序列化它们应该是更好的选择...它们是否包含线性数据,例如每个Hz一行,还是数据已经按对数方案排列,意味着每个八度有相同数量的行/频率?请仔细查看第一张图片和我链接中的图片:标签不是线性的,而是对数的。 - TaW