在测试Chrome缓存处理的奇怪行为时(我在这里问了一些相关问题:here),我发现了另一件事情:当服务器返回304响应时,Chrome开发工具显示200状态代码。
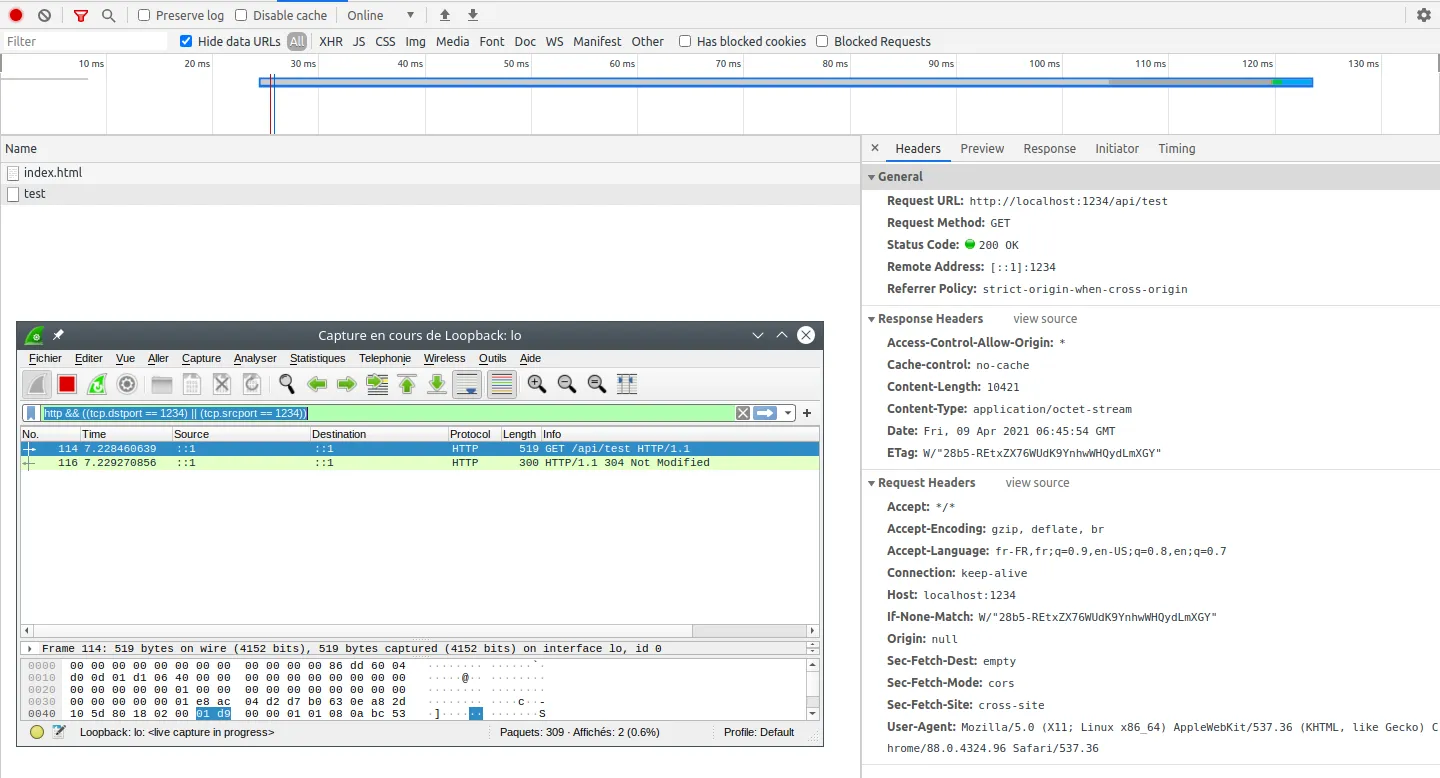
以下是Chrome开发工具显示的内容(200),同时我还包括了一个Wireshark捕获来展示服务器304响应:
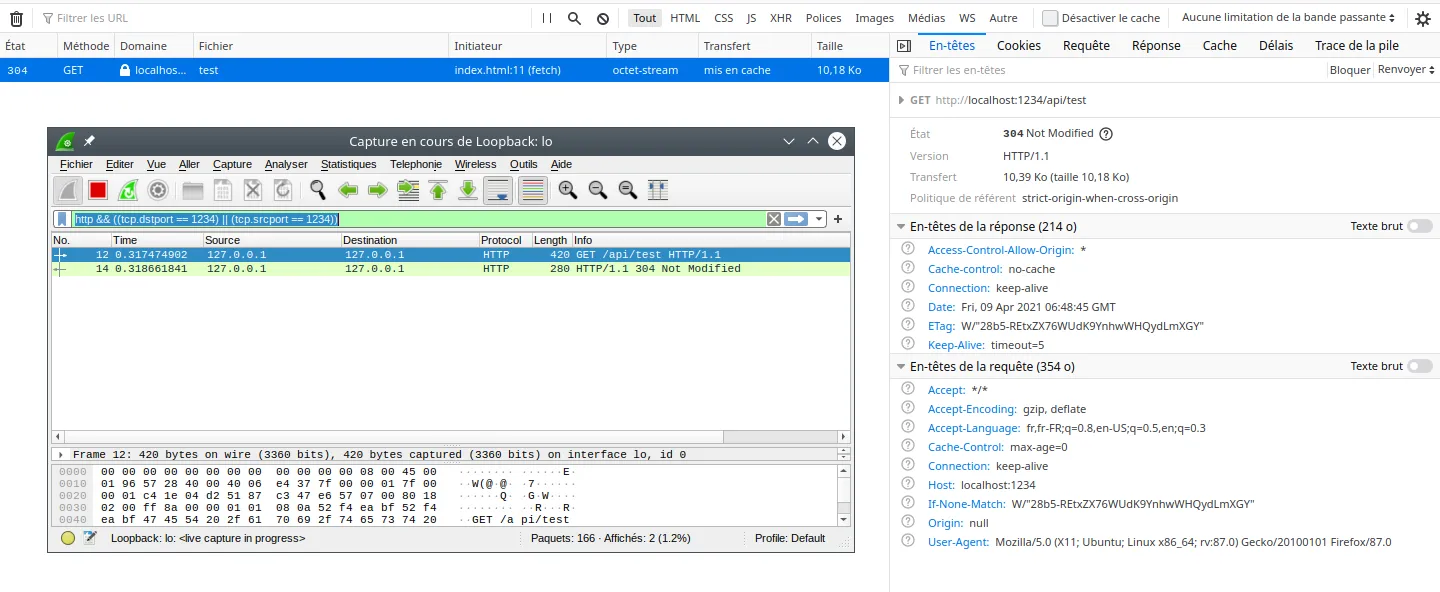
以下是Firefox相同的用法,它显示304代码:
两种浏览器之间最有趣的区别在于时间差异:

Firefox不会显示接收部分的延迟,但Chrome表示需要3.91毫秒。
你有关于为什么Chrome没有显示正确的状态代码的任何想法吗?
如果您想自行测试,请使用以下服务器代码:
#!/usr/bin/env node

'use strict';

const express = require('express');
const cors = require('cors');
const compression = require('compression');
const pathUtils = require('path');
const fs = require('fs');

const http = require('http');
let app = express();
app.disable('x-powered-by');
app.use(express.json({ limit: '50mb' }));
app.use(cors());
app.use(compression({}));
app.use(function (req, res, next) {
    res.set('Cache-control', 'no-cache');
    console.log(req.headers);
    next();
});

let server = http.createServer(app);

app.get('/api/test', (req, res) => {
    res.status(200).send(fs.readFileSync(pathUtils.join(__dirname, 'dummy.txt')));
});

server.listen(1234);
并且客户端:
<!DOCTYPE html>
<html lang="en">
    <head>
        <meta charset="UTF-8" />
        <meta http-equiv="X-UA-Compatible" content="IE=edge" />
        <meta name="viewport" content="width=device-width, initial-scale=1.0" />
        <title>Document</title>
    </head>
    <body>
        <script>
            let test = fetch('http://localhost:1234/api/test').then((res) => {
                console.log(res.status);
                return res.text();
            });
        </script>
    </body>
</html>