我想制作一个程序,它可以将两个矢量相加并将它们的和一起绘制出来。但它们必须是位置矢量。
我尝试创建
如何指定矢量的起始位置,例如使
我尝试创建
v1=[0;2] 和 v2=[1;3],但使用 plot 显示它们会导致许多散点。如何指定矢量的起始位置,例如使
v1 和 v2 从原点开始?我通常使用quiver函数来完成你所描述的操作,其目的是绘制矢量场。你的示例可以用以下方式绘制:
   xx=[0;2];
   yy=[0;0];
   quiver(xx,yy,[0;1],[2;3],0,"linewidth",4);axis equal;xlim([-4 4]);ylim([0 5]);grid on;
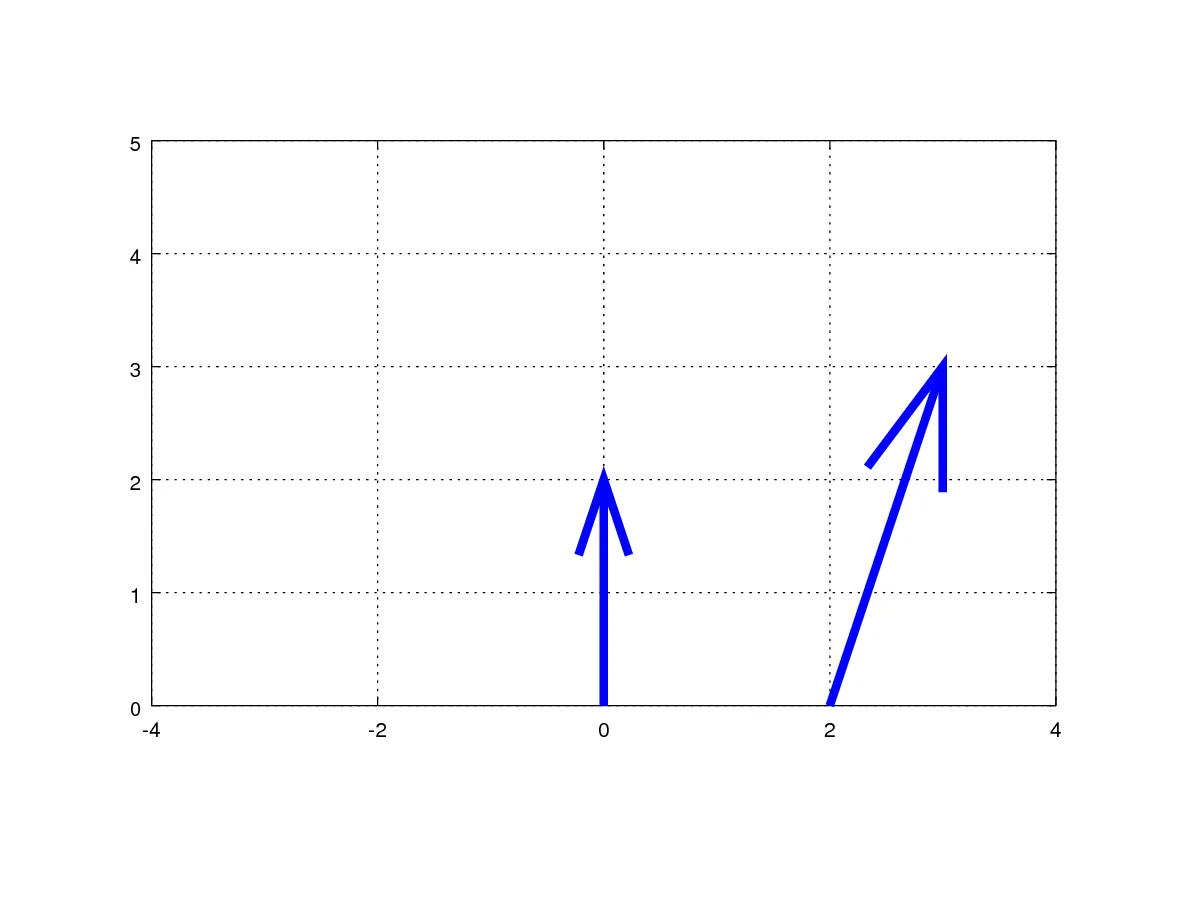
向量的起点由变量xx和yy指定,具体方式如下:第n个向量的起点由[xx(n,1);yy(n,1)]给出(查看help meshgrid以获取有关此信息。基本上,网格是定义函数的域的一种方法,在这里它恰好是一个向量场)。
quiver([0], [0], [5], [4])与quiver([0; 0], [0; 0], [5; 2], [4; 3]);,看看向量[5; 4]如何在将另一个向量([2; 3])作为quiver的参数添加时被缩小)。 - Cromax这里是在Octave中绘制数学向量的示例:
clf
xs=[0 0 1 5 0]
ys=[0 0 7 1 0]
xe=[5 1 5 1 6]
ye=[1 7 1 7 8]
q=1;
h=quiver(xs(q),ys(q),xe(q),ye(q), 0,'b');
hold on
set (h, "maxheadsize", 0.033);
q=3;
h=quiver(xs(q),ys(q),xe(q),ye(q), 0,'--b');
set (h, "maxheadsize", 0.033);
q=2;
h=quiver(xs(q),ys(q),xe(q),ye(q), 0,'r');
set (h, "maxheadsize", 0.033);
q=4;
h=quiver(xs(q),ys(q),xe(q),ye(q), 0,'--r');
set (h, "maxheadsize", 0.033);
q=5;
h=quiver(xs(q),ys(q),xe(q),ye(q), 0,'g');
set (h, "maxheadsize", 0.033);
axis("square")
grid on
hold off