我无法找到一个具有所需功能的库,因此最终编写了一个脚本来实现:
脚本:
import matplotlib.pyplot as plt
import matplotlib as mpl
import numpy as np
import matplotlib.patches as patches
import datetime as dt
import csv
import sys
MINUTES_IN_DAY = 1440.0
COLUMN_COLOUR = 'b'
def plotData(data,columnColour,maxDate,minDate):
x = mpl.dates.drange(minDate,maxDate,dt.timedelta(days=1))
x[0] += 0.85
times = x % 1 + int(x[0])
fig = plt.figure()
fig.suptitle('Daily Sleep Patterns', fontsize=14, fontweight='bold')
ax = fig.add_subplot(111)
ax.plot_date(x, times, 'ro', color='w', visible=False)
ax.yaxis_date()
fig.autofmt_xdate()
start, end = ax.get_ylim()
hourDivision = 1.0 / 24.0
ax.yaxis.set_ticks(np.arange(start,end,hourDivision))
ax.set_yticklabels(['Midnight','1am','2am','3am','4am','5am','6am','7am','8am','9am','10am','11am','Midday','1pm','2pm','3pm','4pm','5pm','6pm','7pm','8pm','9pm','10pm','11pm','Midnight'])
for i in range(0,len(data)):
if data[i].startTime > data[i].stopTime:
currentDataItem = data[i]
currentDate = dt.datetime(currentDataItem.year,currentDataItem.month,currentDataItem.day)
currentDate -= dt.timedelta(days=0.5)
tomorrow = currentDate + dt.timedelta(days=1)
plt.axvspan(xmin=currentDate, xmax=tomorrow, ymin=currentDataItem.startTime, ymax=1, facecolor=columnColour, alpha=0.5)
theDayAfterTomorrow = tomorrow + dt.timedelta(days=1)
plt.axvspan(xmin=tomorrow, xmax=theDayAfterTomorrow, ymin=0, ymax=currentDataItem.stopTime, facecolor=columnColour, alpha=0.5)
else:
currentDataItem = data[i]
currentDate = dt.datetime(currentDataItem.year,currentDataItem.month,currentDataItem.day)
currentDate -= dt.timedelta(days=0.5)
tomorrow = currentDate + dt.timedelta(days=1)
plt.axvspan(xmin=currentDate, xmax=tomorrow, ymin=currentDataItem.startTime, ymax=currentDataItem.stopTime, facecolor=columnColour, alpha=0.5)
ax.set_ylabel('Hours',fontweight='bold')
ax.grid(True)
plt.show()
def readDataFromFile(dataFile):
f = open(dataFile,'rt')
listOfInputLists = []
try:
reader = csv.reader(f)
for row in reader:
listOfInputLists.append(row)
finally:
f.close()
return listOfInputLists
class sleepInstance(object):
def __init__(self,listOfInputLists):
self.day = 0
self.month = 0
self.year = 0
self.formatDate(listOfInputLists[0])
self.startTime = self.formatTime(listOfInputLists[1])
self.stopTime = self.formatTime(listOfInputLists[2])
def formatDate(self,unformattedDate):
date = dt.datetime.strptime(unformattedDate,"%d/%m/%y")
self.day = int(date.strftime("%d"))
self.month = int(date.strftime("%m"))
self.year = int(date.strftime("%Y"))
def formatTime(self,unformattedTime):
timeSinceMidnight = dt.datetime.strptime(unformattedTime,'%H:%M:%S')
midnight = dt.datetime(1900,1,1)
minutesSinceMidnight = ((timeSinceMidnight - midnight).total_seconds() / 60.0)
fractionOfDay = minutesSinceMidnight / MINUTES_IN_DAY
return fractionOfDay
def formatDataForPlot(listOfInputLists):
sleeps = []
for i in range(1,len(listOfInputLists)):
sleeps.append(sleepInstance(listOfInputLists[i]))
return sleeps
def getMaxAndMinDates(plotDataList):
dateTimeList = []
for item in plotDataList:
nextDate = dt.datetime(item.year,item.month,item.day)
dateTimeList.append(nextDate)
maxDate = max(dateTimeList)
minDate = min(dateTimeList)
return maxDate, minDate
dataFile = 'sleepData.csv'
listOfInputLists = readDataFromFile(dataFile)
plotDataList = formatDataForPlot(listOfInputLists)
maxDate, minDate = getMaxAndMinDates(plotDataList)
plotData(plotDataList,COLUMN_COLOUR,maxDate,minDate)
输入:
Date,Start,Finish
17/03/17,03:15:00,03:55:00
17/03/17,06:20:00,06:35:00
17/03/17,09:00:00,09:40:00
17/03/17,13:10:00,13:35:00
17/03/17,15:45:00,16:30:00
17/03/17,18:45:00,19:25:00
17/03/17,21:15:00,21:35:00
18/03/17,00:30:00,02:00:00
18/03/17,04:50:00,05:05:00
18/03/17,08:20:00,08:40:00
18/03/17,12:30:00,13:10:00
18/03/17,16:30:00,17:00:00
18/03/17,18:45:00,19:00:00
18/03/17,20:30:00,21:00:00
19/03/17,00:00:00,12:00:00
19/03/17,18:00:00,23:59:00
19/03/17,13:00:00,14:00:00
20/03/17,12:00:00,11:00:00
输出:
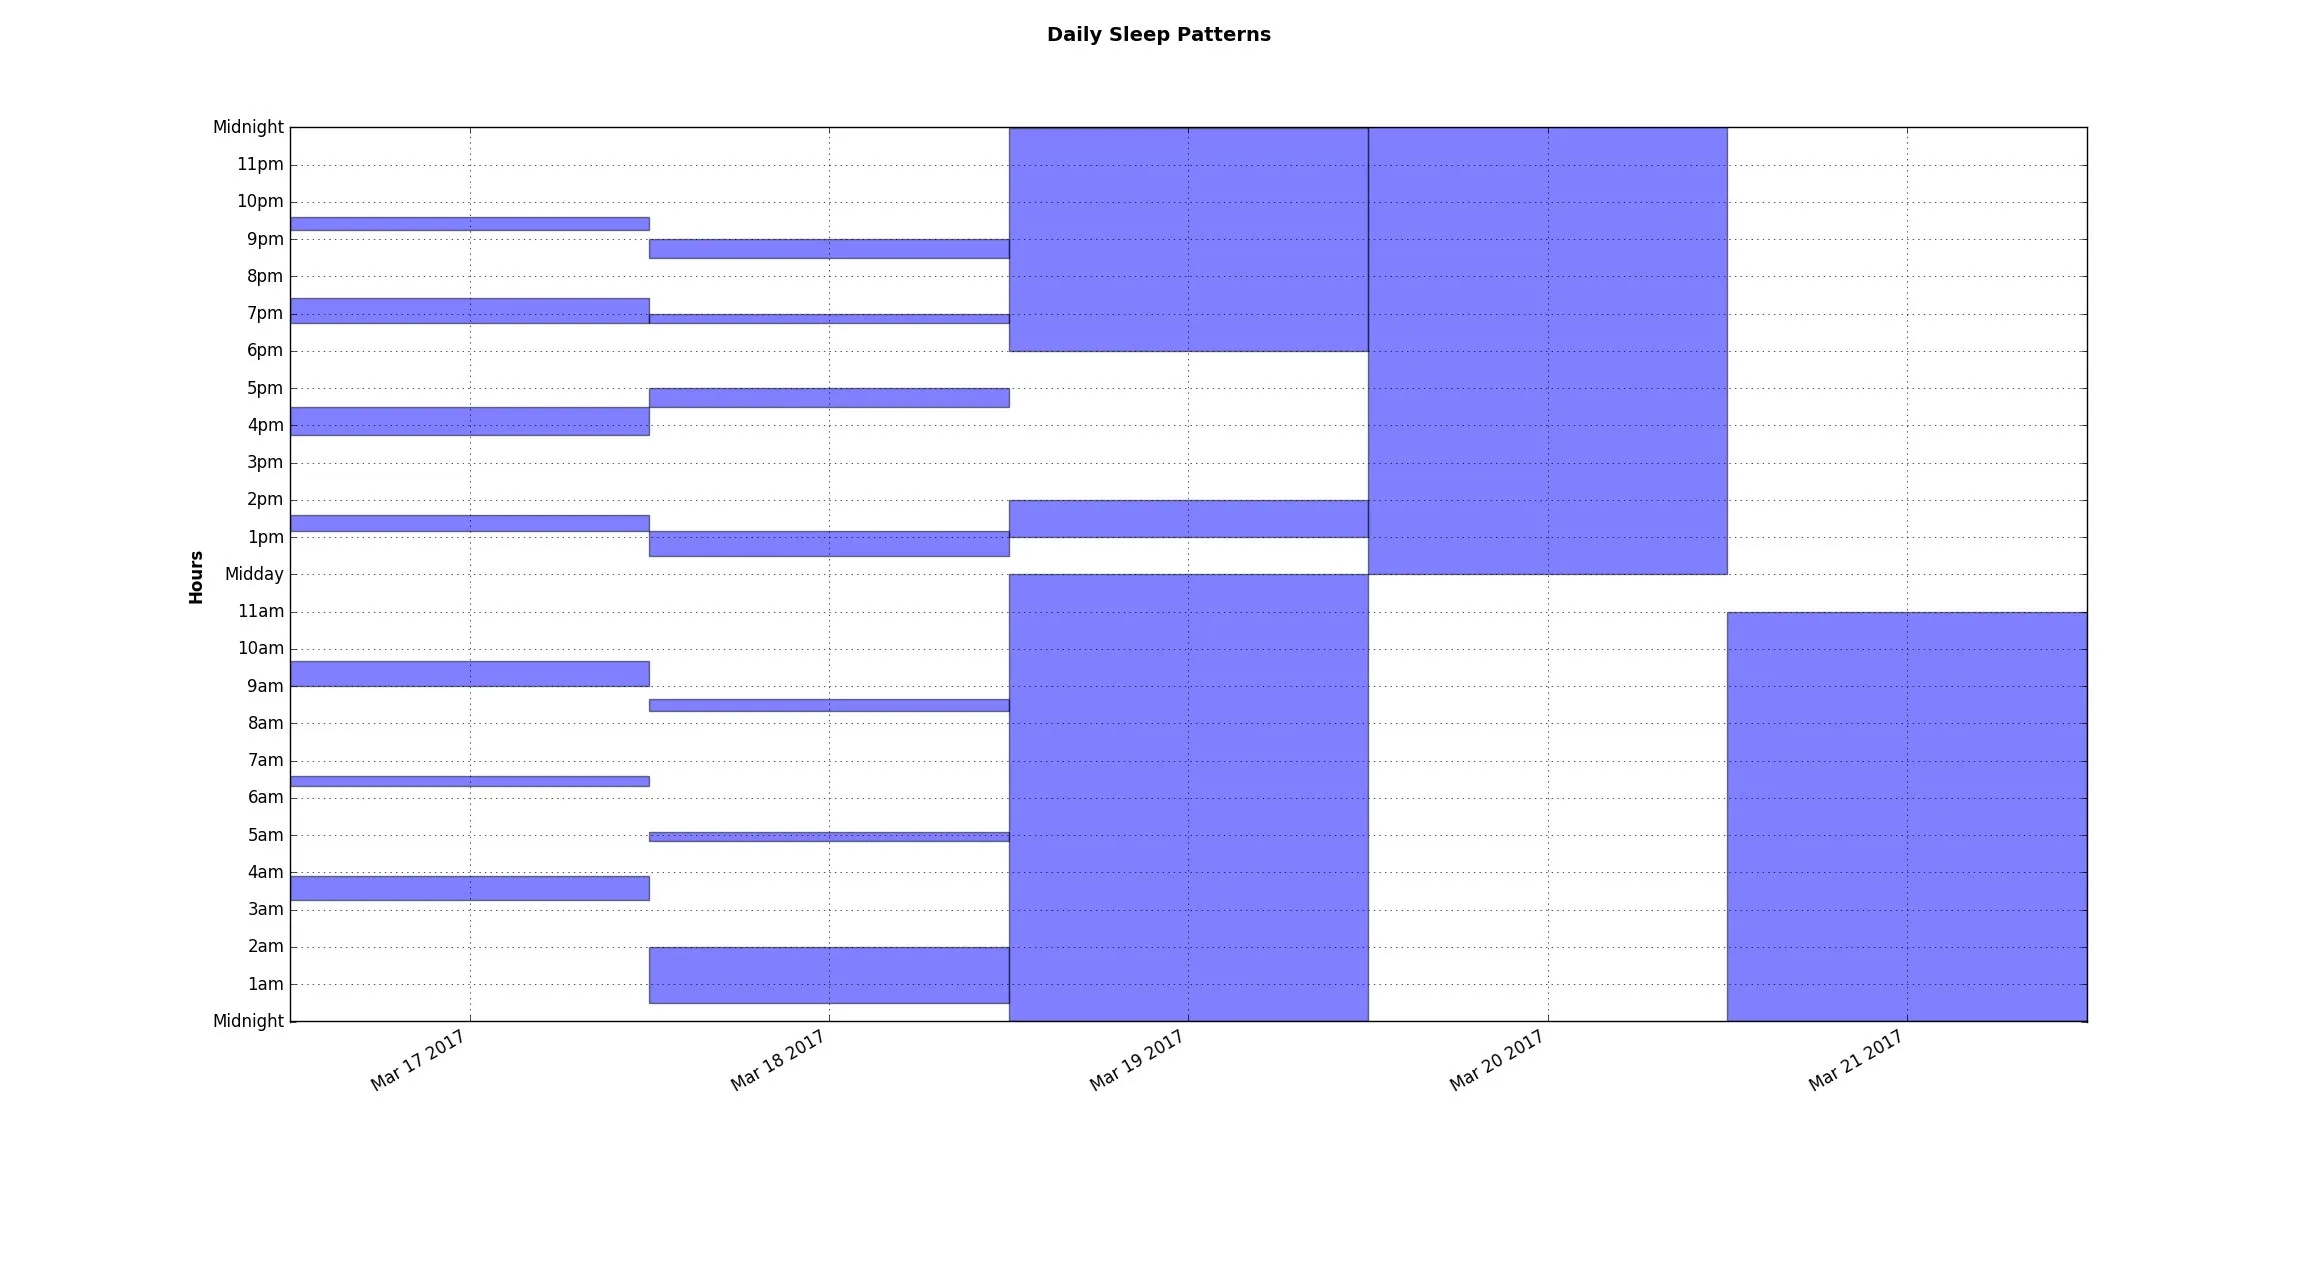
有时间的话,我可能会对它进行一些美化:https://github.com/ambidextrous/timeLogGrapher
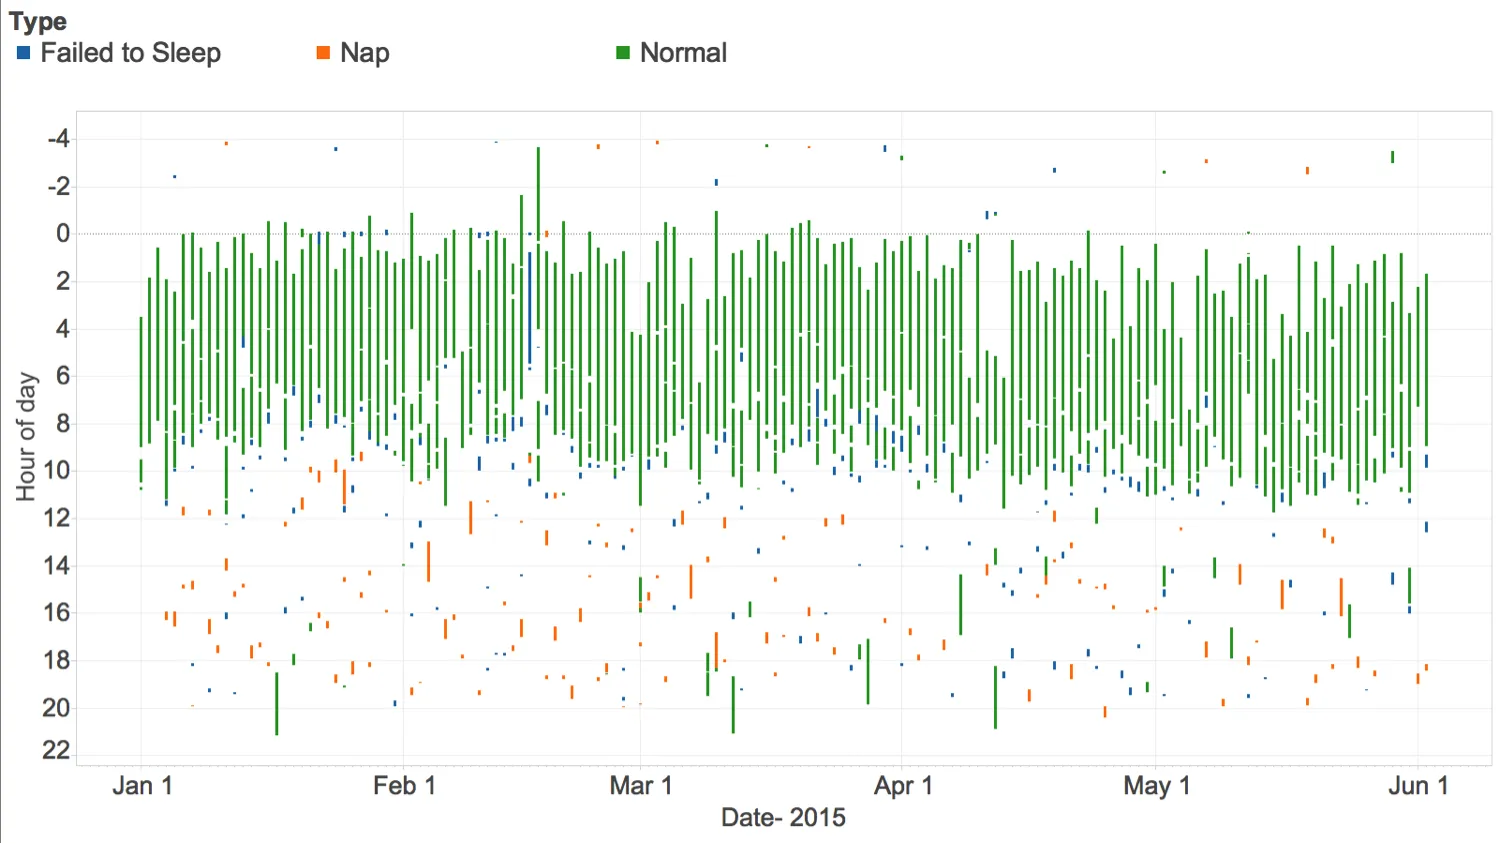 图片来源: http://quantifiedself.com/wp-content/uploads/2015/08/qs2.png
我知道这是一个非常简单的可视化图表,而且想象中它已经被构建到某个现有的库中,但是我的最佳搜索结果无法找到它。如果有人能指点我正确的方向,我将不胜感激。
图片来源: http://quantifiedself.com/wp-content/uploads/2015/08/qs2.png
我知道这是一个非常简单的可视化图表,而且想象中它已经被构建到某个现有的库中,但是我的最佳搜索结果无法找到它。如果有人能指点我正确的方向,我将不胜感激。
plot.ly。看起来你可能需要查看散点图部分。 - shad0w_wa1k3r