GoogleVis图表在Rmarkdown中无法渲染

4

在Rmarkdown之外,独立的googleVis图表运行良好,但当我将其插入Rmarkdown文件时,我只收到Rmarkdown代码:
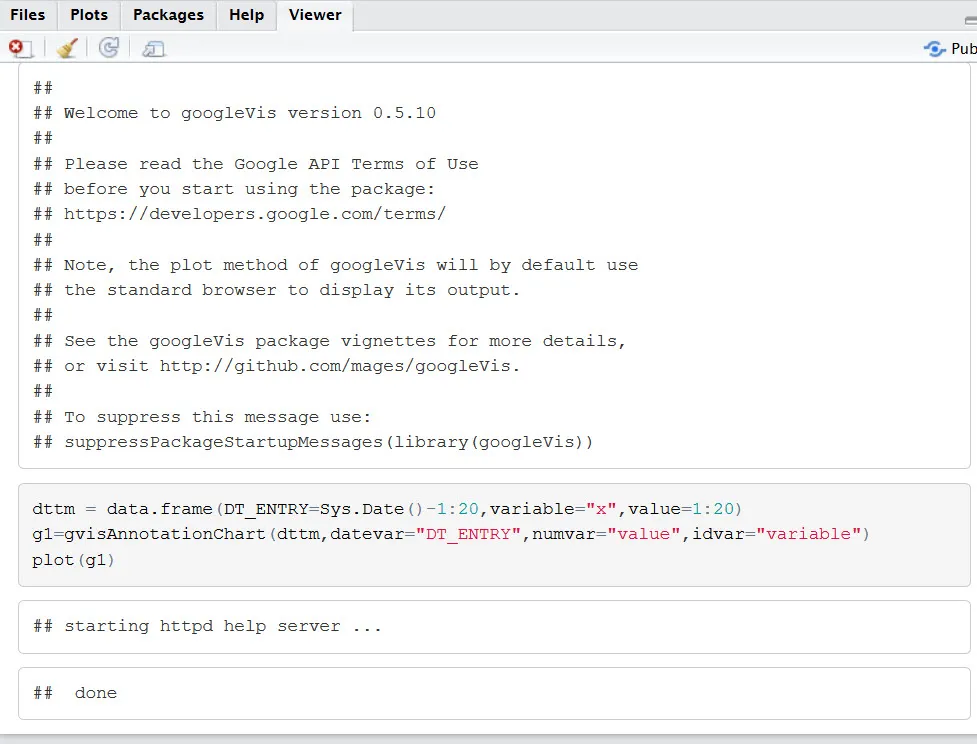
查看器输出:

enter image description here

> TEST H 4/13/2016 require(googleVis) Loading required package:
> googleVis Welcome to googleVis version 0.5.10 Please read the Google
> API Terms of Use before you start using the package:
> https://developers.google.com/terms/
> 
> Note, the plot method of googleVis will by default use the standard
> browser to display its output.   See the googleVis package vignettes
> for more details, or visit http://github.com/mages/googleVis.   To
> suppress this message use:
> suppressPackageStartupMessages(library(googleVis))
> 
> dttm = data.frame(DT_ENTRY=Sys.Date()-1:20,variable="x",value=1:20)
> g1=gvisAnnotationChart(dttm,datevar="DT_ENTRY",numvar="value",idvar="variable")
> plot(g1) starting httpd help server ... done

以下是Rmarkdown代码:
---
title: "test"
author: "H"
date: "4/13/2016"
output: html_document
highlight: tango
number_sections: yes
---

```{r}
require(googleVis)
dttm = data.frame(DT_ENTRY=Sys.Date()-1:20,variable="x",value=1:20)
g1=gvisAnnotationChart(dttm,datevar="DT_ENTRY",numvar="value",idvar="variable")
plot(g1)
```
2个回答

2

r代码块必须声明为:

```{r plotg0,  results='asis', tidy=FALSE, echo=FALSE}

"asis"很重要,因为它返回原始的HTML。

1
我不确定您是否还需要答案。然而,当我尝试将来自gvisSankey的桑基图嵌入到Rmarkdown的部分中时,我遇到了同样的问题。幸运的是,我在github.com/mages/googleVis上找到了解决方案(奇怪的是,在Google搜索中没有推荐)。
以下是一个可重现的示例。
首先,要创建桑基图,我这样做:

    # install.packages("googleVis")
    library(googleVis)
    
    # Create a data.frame that is gvisSankey-conform
    # i.e., has these columns: FROM - TO - WEIGHT
    df <- data.frame(FROM = rep(c("A","B","C"), each = 3),
                     TO = rep(c("D","E","F"), times = 3),
                     WEIGHT = sample(1:10, 9, replace = TRUE))
    
    sankeyplot <- gvisSankey(data = df,
                             from = "FROM",
                             to = "TO",
                             weight = "WEIGHT")
    
    plot(sankeyplot)

plot(sankeyplot)会打开一个包含sankeyplot的新标签页。那么,我如何将sankeyplot嵌入到我的Rmarkdown中呢?

有两个重要的点:

  • 在YAML头中设置self_contained:false
  • 在包含sankeyplot的R代码块中设置results='asis'
    ---
    title: "SankeyPlot_Example"
    output: 
      html_document:
        self_contained: false
    date: '2022-10-21'
    ---
    
    ## Embed googleVis object (sankey plot) onto Rmarkdown
    
    ```{r setup, include=FALSE}
    knitr::opts_chunk$set(echo = TRUE)
    library(googleVis)
    
    # Create a reproducible data.frame
    df <- data.frame(FROM = rep(c("A","B","C"), each = 3),
                     TO = rep(c("D","E","F"), times = 3),
                     WEIGHT = sample(1:10, 9, replace = TRUE))
    ```
    
    ```{r results='asis'}
    sankeyplot <- gvisSankey(data = df,
                             from = "FROM",
                             to = "TO",
                             weight = "WEIGHT")
    
    print(sankeyplot, 'chart')
    ```

网页内容由stack overflow 提供, 点击上面的
可以查看英文原文,
原文链接