我希望能够计算从红外相机生成的图像中形状的面积。我有一组大型矩阵,这些矩阵是从红外相机中生成的。在每个矩阵/图像中,我大多数都是背景,并带有一个点的图像,该点是红外辐射源。我使用Python OpenCV来隔离源图像,通过将背景置零并计算形状中的像素数来解决问题。问题在于,在每个图像中,部分图像也会变成背景,因此我无法获得完整的图像,就像我想要的那样。
import cv2
import numpy as np
from matplotlib import pyplot as plt
PPmm = 81/55 #Pixel per mm
img = np.genfromtxt('Image 5 Z_plane = 141.0_contour_plot.csv', delimiter= ',')
img_cv = cv2.resize(img,(81,81))
np.savetxt('testing.csv', img_cv, delimiter= ',')
img = (img_cv*255).astype(np.uint8)
edges = cv2.Canny(img,150,250)
se = np.ones((7,7), dtype='uint8')
# Perform morphology
image_close = cv2.morphologyEx(edges, cv2.MORPH_CLOSE, se)
# Your code now applied to the closed image
cnt = cv2.findContours(image_close, cv2.RETR_EXTERNAL, cv2.CHAIN_APPROX_SIMPLE)[0]
mask = np.zeros(img.shape[:2], np.uint8)
cv2.drawContours(mask, cnt, -1, 255, -1)
non_zero_pixel_count = (np.count_nonzero(mask))
Area_in_mm = non_zero_pixel_count*(1/PPmm)**2
print("Area of shape = {0:1f}mm^2".format(Area_in_mm))
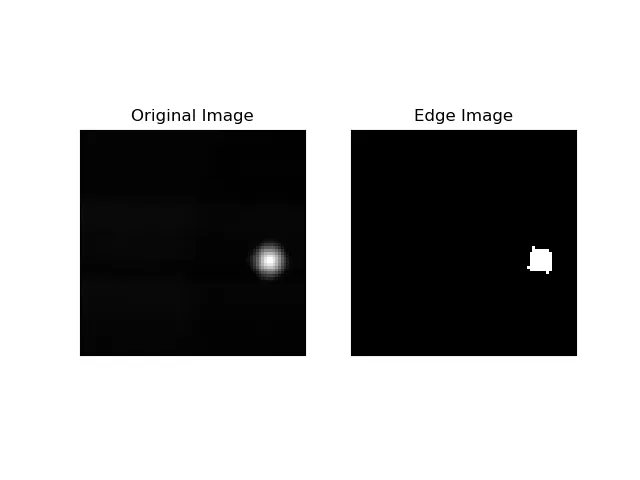
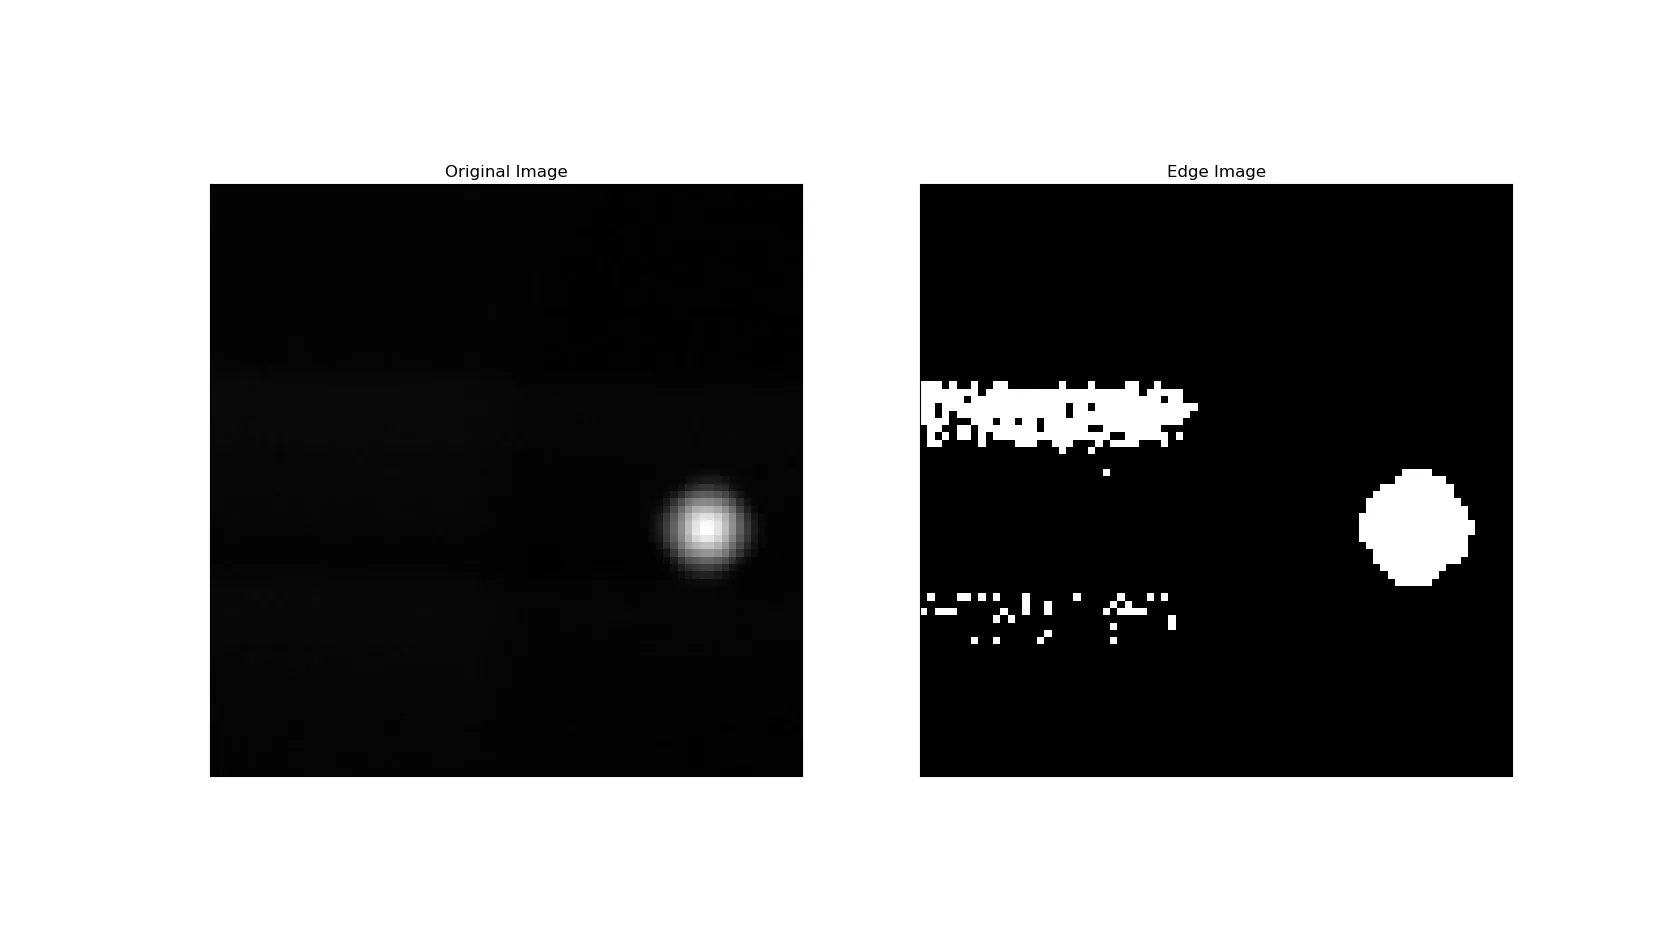
plt.subplot(121)
plt.imshow(img,cmap = 'gray')
plt.title('Original Image')
plt.xticks([])
plt.yticks([])
plt.subplot(122)
plt.imshow(mask,cmap = 'gray')
plt.title('Edge Image'), plt.xticks([]), plt.yticks([])
[enter image description here][1]
plt.show()
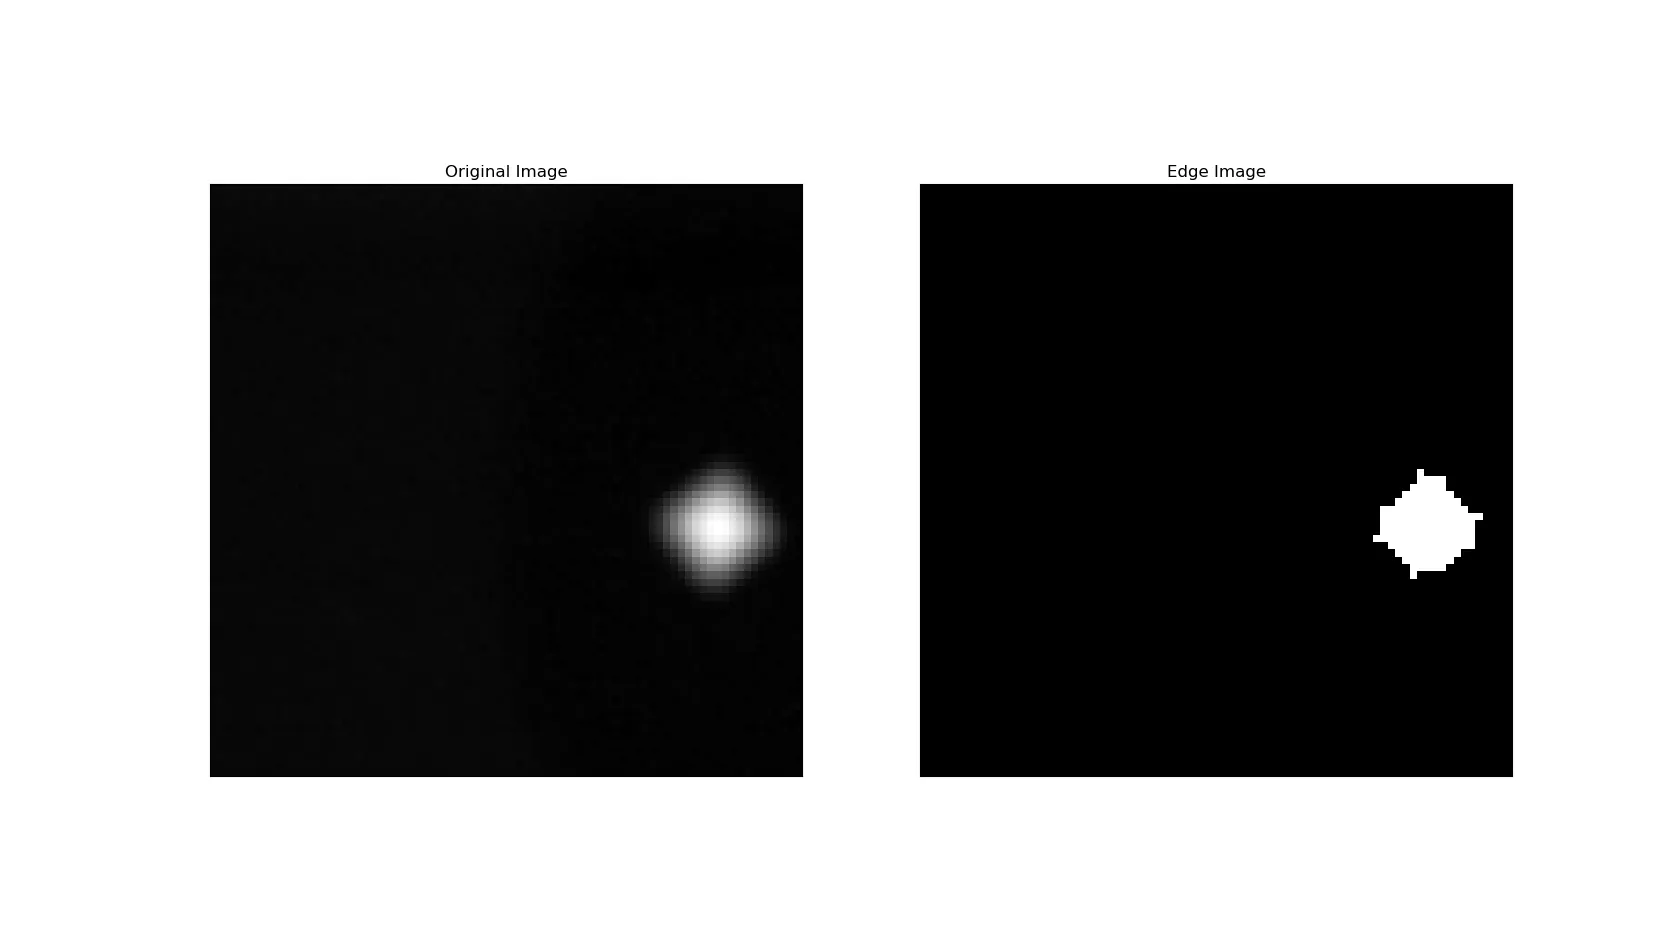
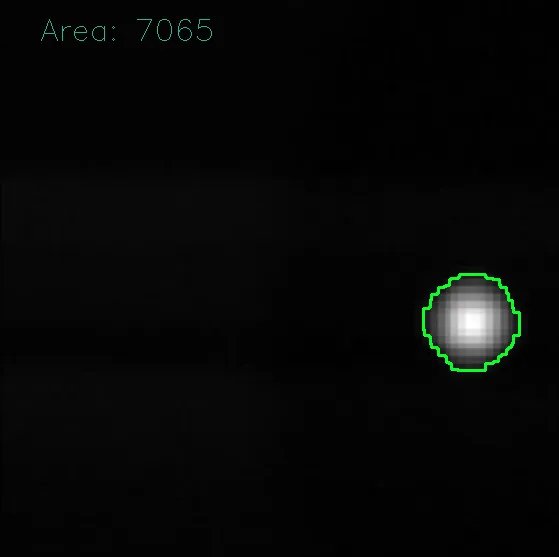
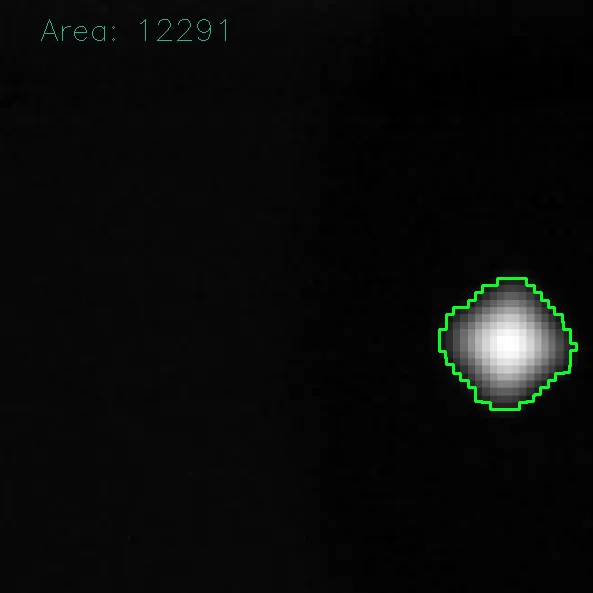
形状面积为:58.093278平方毫米。如果我手动计算,大约将得到68平方毫米。在圆形图像中,这甚至更糟糕,我得到的面积是两倍小。
圆形图像
正方形图像

