使用title_fmt
您可以通过关键字参数title_fmt来格式化标题:
title_fmt : string
    The format string for the quantiles given in titles. If you explicitly
    set ``show_titles=True`` and ``title_fmt=None``, the labels will be
    shown as the titles. (default: ``.2f``)
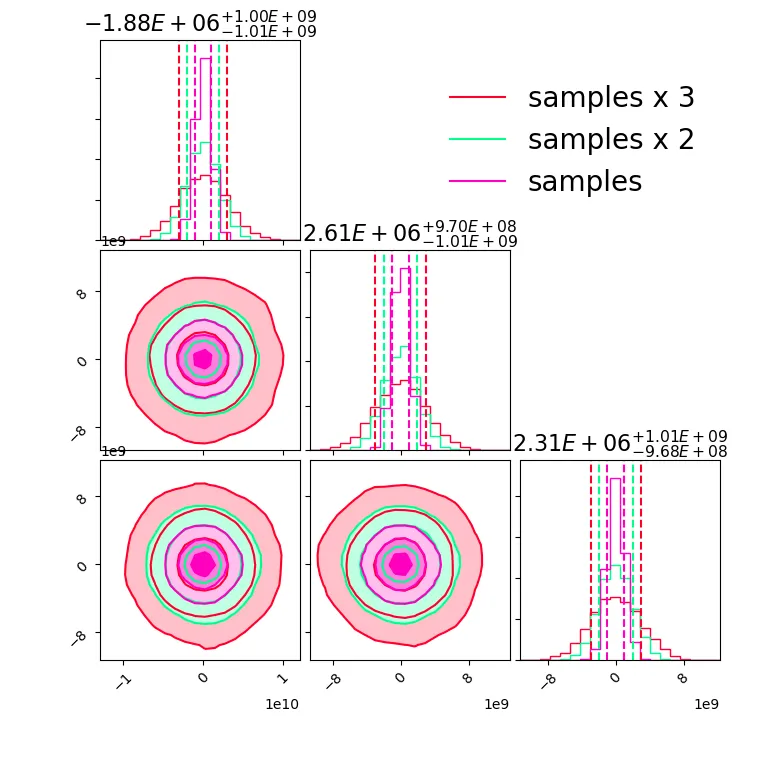
在你的情况下,你可以设置title_fmt=".2E"
示例
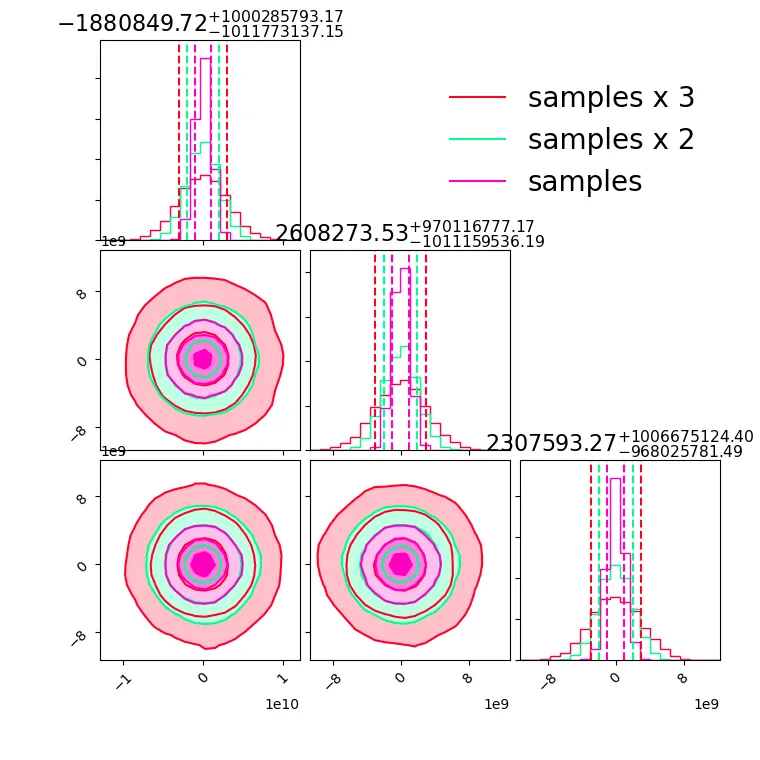
在指定 title_fmt 之前:
在指定 title_fmt=".2E" 之后:
示例代码
"""Corner on top of each other"""
import corner
import matplotlib.lines as mlines
import matplotlib.pyplot as plt
import numpy as np
CORNER_KWARGS = dict(
smooth=0.9,
label_kwargs=dict(fontsize=16),
title_kwargs=dict(fontsize=16),
quantiles=[0.16, 0.84],
levels=(1 - np.exp(-0.5), 1 - np.exp(-2), 1 - np.exp(-9 / 2.)),
plot_density=False,
plot_datapoints=False,
fill_contours=True,
show_titles=True,
max_n_ticks=3,
title_fmt=".2E"
)
def overlaid_corner(samples_list, sample_labels):
"""Plots multiple corners on top of each other"""
n = len(samples_list)
_, ndim = samples_list[0].shape
max_len = max([len(s) for s in samples_list])
cmap = plt.cm.get_cmap('gist_rainbow', n)
colors = [cmap(i) for i in range(n)]
plot_range = []
for dim in range(ndim):
plot_range.append(
[
min([min(samples_list[i].T[dim]) for i in range(n)]),
max([max(samples_list[i].T[dim]) for i in range(n)]),
]
)
CORNER_KWARGS.update(range=plot_range)
fig = corner.corner(
samples_list[0],
color=colors[0],
**CORNER_KWARGS
)
for idx in range(1, n):
fig = corner.corner(
samples_list[idx],
fig=fig,
weights=get_normalisation_weight(len(samples_list[idx]), max_len),
color=colors[idx],
**CORNER_KWARGS
)
plt.legend(
handles=[
mlines.Line2D([], [], color=colors[i], label=sample_labels[i])
for i in range(n)
],
fontsize=20, frameon=False,
bbox_to_anchor=(1, ndim), loc="upper right"
)
plt.savefig("orig_corner.png")
plt.close()
def get_normalisation_weight(len_current_samples, len_of_longest_samples):
return np.ones(len_current_samples) * (len_of_longest_samples / len_current_samples)
def main():
ndim, nsamples = 3, 10000
np.random.seed(2000)
samples = np.random.randn(ndim * nsamples).reshape([nsamples, ndim]) * 1e9
overlaid_corner(
[samples * 3, samples * 2, samples],
["samples x 3", "samples x 2", "samples"]
)
if __name__ == "__main__":
main()
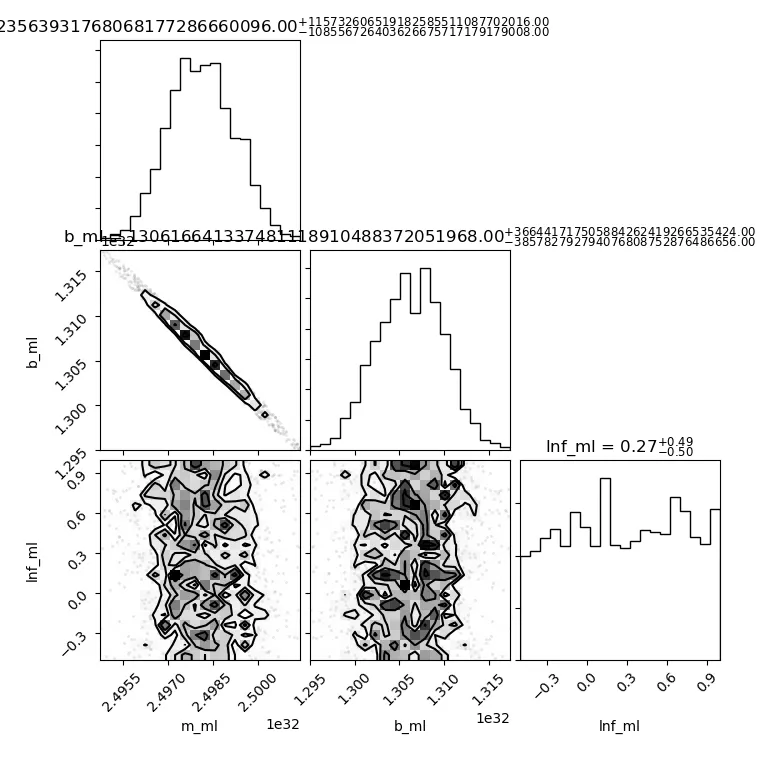 有没有办法在科学计数法中显示大数,而将小数显示为浮点数?x轴刻度标签已经可以做到这一点。我希望拟合结果标题也能做到这一点。