这可以通过使用不同的rad参数来绘制每个边来完成-如所示。请注意,我的方法使用了f-strings,需要Python 3.6-在此之下,您将不得不使用另一种方法构建字符串。
代码:
import networkx as nx
import matplotlib.pyplot as plt
G = nx.MultiDiGraph()
G.add_node('n1')
G.add_node('n2')
G.add_edge('n1', 'n2', rad=0.1)
G.add_edge('n1', 'n2', rad=0.2)
G.add_edge('n1', 'n2', rad=0.3)
plt.figure(figsize=(6,6))
pos = nx.spring_layout(G)
nx.draw_networkx_nodes(G, pos)
nx.draw_networkx_labels(G, pos)
for edge in G.edges(data=True):
nx.draw_networkx_edges(G, pos, edgelist=[(edge[0],edge[1])], connectionstyle=f'arc3, rad = {edge[2]["rad"]}')
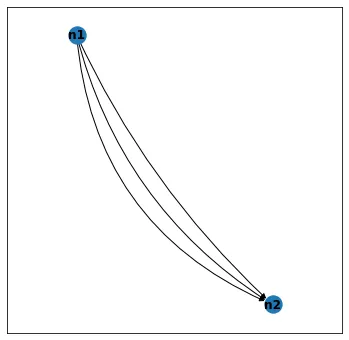
plt.show()
输出:
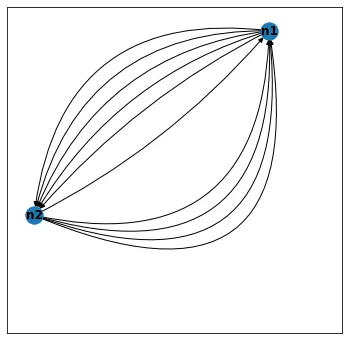
我们甚至可以创建一个新的函数来帮我们完成这个任务:
import networkx as nx
import matplotlib.pyplot as plt

def new_add_edge(G, a, b):
    if (a, b) in G.edges:
        max_rad = max(x[2]['rad'] for x in G.edges(data=True) if sorted(x[:2]) == sorted([a,b]))
    else:
        max_rad = 0
    G.add_edge(a, b, rad=max_rad+0.1)

G = nx.MultiDiGraph()
G.add_node('n1')
G.add_node('n2')

for i in range(5):
    new_add_edge(G, 'n1', 'n2')

for i in range(5):
    new_add_edge(G, 'n2', 'n1')

plt.figure(figsize=(6,6))

pos = nx.spring_layout(G)
nx.draw_networkx_nodes(G, pos)
nx.draw_networkx_labels(G, pos)

for edge in G.edges(data=True):
    nx.draw_networkx_edges(G, pos, edgelist=[(edge[0],edge[1])], connectionstyle=f'arc3, rad = {edge[2]["rad"]}')

plt.show()
输出: