自2020年5月发布版本1.37.1起,
texreg 引入了
threeparttable 参数,该参数使用了为此目的而设计的
threeparttable LaTeX包。
示例 R 代码:
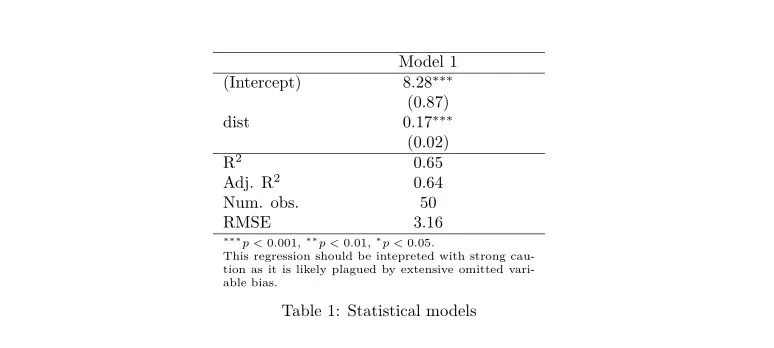
texreg(lm(speed ~ dist, data = cars),
       custom.note = paste("\\item %stars. This regression",
                           "should be interpreted with strong",
                           "caution as it is likely plagued by",
                           "extensive omitted variable bias."),
       single.row = TRUE,
       threeparttable = TRUE)
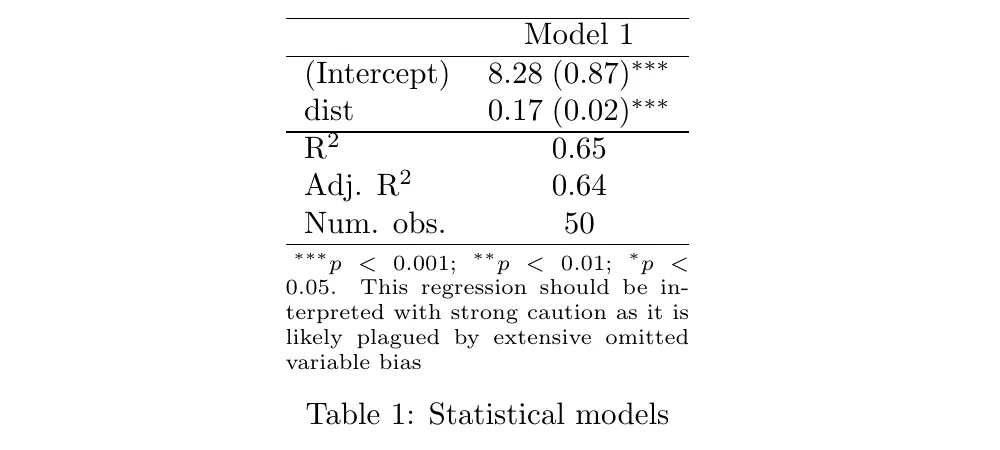
输出:
\begin{table}
\begin{center}
\begin{threeparttable}
\begin{tabular}{l c}
\hline
 & Model 1 \\
\hline
(Intercept) & $8.28 \; (0.87)^{***}$ \\
dist        & $0.17 \; (0.02)^{***}$ \\
\hline
R$^2$       & $0.65$                 \\
Adj. R$^2$  & $0.64$                 \\
Num. obs.   & $50$                   \\
\hline
\end{tabular}
\begin{tablenotes}[flushleft]
\scriptsize{\item $^{***}p<0.001$; $^{**}p<0.01$; $^{*}p<0.05$. This regression should be interpreted with strong caution as it is likely plagued by extensive omitted variable bias}
\end{tablenotes}
\end{threeparttable}
\caption{Statistical models}
\label{table:coefficients}
\end{center}
\end{table}
该段落会显示为:
请注意,自定义注释必须以\\item开头。还可以有多个项目和/或使用符号来格式化多个笔记,例如列表:
texreg(lm(speed ~ dist, data = cars),
       custom.note = paste("\\item[$\\bullet$] %stars.",
                           "\\item[$\\bullet$] This regression",
                           "should be interpreted with strong",
                           "caution as it is likely plagued by",
                           "extensive omitted variable bias."),
       single.row = TRUE,
       threeparttable = TRUE)
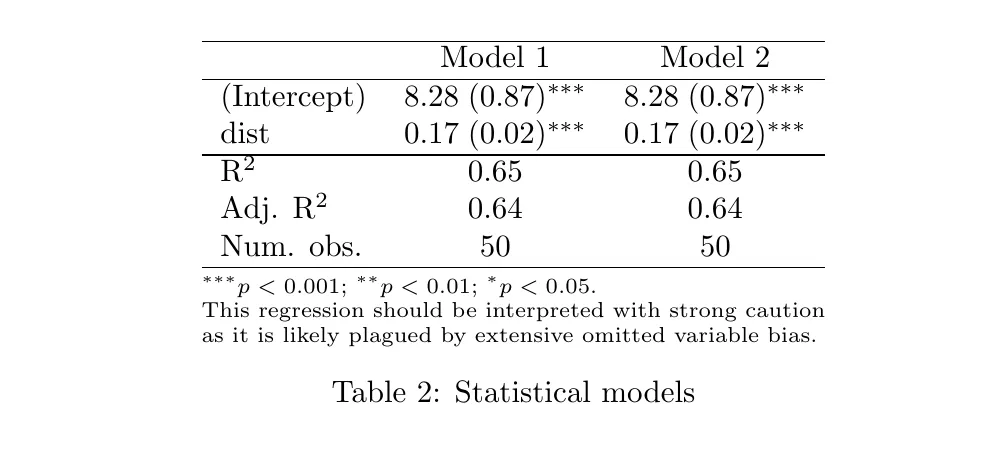
格式可能不完美,因为您不能设置表格的所需宽度;注释只会调整到相应表格的宽度。但我认为,在现实使用场景中,显示多个模型并且一些系数名称比示例中更长的情况下,这应该不是太大的问题。此解决方案还支持
longtable 环境,在这种情况下,将使用
threeparttablex 包。以下是如何使用两个模型使其看起来漂亮的示例:
fit <- lm(speed ~ dist, data = cars)
texreg(list(fit, fit),
       custom.note = paste("\\item[\\hspace{-5mm}] %stars.",
                           "\\item[\\hspace{-5mm}] This regression",
                           "should be interpreted with strong",
                           "caution as it is likely plagued by",
                           "extensive omitted variable bias."),
       single.row = TRUE,
       threeparttable = TRUE)
这将产生:
\begin{table}
\begin{center}
\begin{threeparttable}
\begin{tabular}{l c c}
\hline
 & Model 1 & Model 2 \\
\hline
(Intercept) & $8.28 \; (0.87)^{***}$ & $8.28 \; (0.87)^{***}$ \\
dist        & $0.17 \; (0.02)^{***}$ & $0.17 \; (0.02)^{***}$ \\
\hline
R$^2$       & $0.65$                 & $0.65$                 \\
Adj. R$^2$  & $0.64$                 & $0.64$                 \\
Num. obs.   & $50$                   & $50$                   \\
\hline
\end{tabular}
\begin{tablenotes}[flushleft]
\scriptsize{\item[\hspace{-5mm}] $^{***}p<0.001$; $^{**}p<0.01$; $^{*}p<0.05$. \item[\hspace{-5mm}] This regression should be interpreted with strong caution as it is likely plagued by extensive omitted variable bias.}
\end{tablenotes}
\end{threeparttable}
\caption{Statistical models}
\label{table:coefficients}
\end{center}
\end{table}
这会被渲染成:
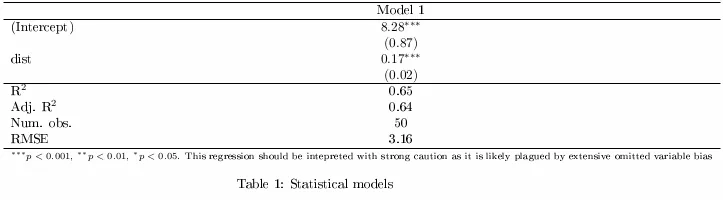
parbox是我现在自己使用的! - MichaelChirico{r ...块之前添加\renewcommand\arraystretch{1.3}。 - jay.sf