在定义了
ax1=fig1.add_subplot(111)并绘制了8个数据系列及其关联的label值之后,我使用了以下代码行添加图例。ax1.legend(loc='center left', bbox_to_anchor=(1.0, 0.5))
我以前多次使用这种方法而没有问题,但这一次却出现了一个错误,显示IndexError: tuple index out of range
Traceback (most recent call last):
   File "interface_tension_adhesion_plotter.py", line 45, in <module>
      ax1.legend(loc='center left', bbox_to_anchor=(1.0, 0.5))
   File "/Library/Frameworks/Python.framework/Versions/3.5/lib/python3.5/site-packages/matplotlib/axes/_axes.py", line 564, in legend
      self.legend_ = mlegend.Legend(self, handles, labels, **kwargs)
   File "/Library/Frameworks/Python.framework/Versions/3.5/lib/python3.5/site-packages/matplotlib/legend.py", line 386, in __init__
      self._init_legend_box(handles, labels, markerfirst)
   File "/Library/Frameworks/Python.framework/Versions/3.5/lib/python3.5/site-packages/matplotlib/legend.py", line 655, in _init_legend_box
      fontsize, handlebox))
   File "/Library/Frameworks/Python.framework/Versions/3.5/lib/python3.5/site-packages/matplotlib/legend_handler.py", line 119, in legend_artist
      fontsize, handlebox.get_transform())
   File "/Library/Frameworks/Python.framework/Versions/3.5/lib/python3.5/site-packages/matplotlib/legend_handler.py", line 476, in create_artists
      self.update_prop(coll, barlinecols[0], legend)
IndexError: tuple index out of range
我不知道为什么会发生这种情况,非常希望得到建议。
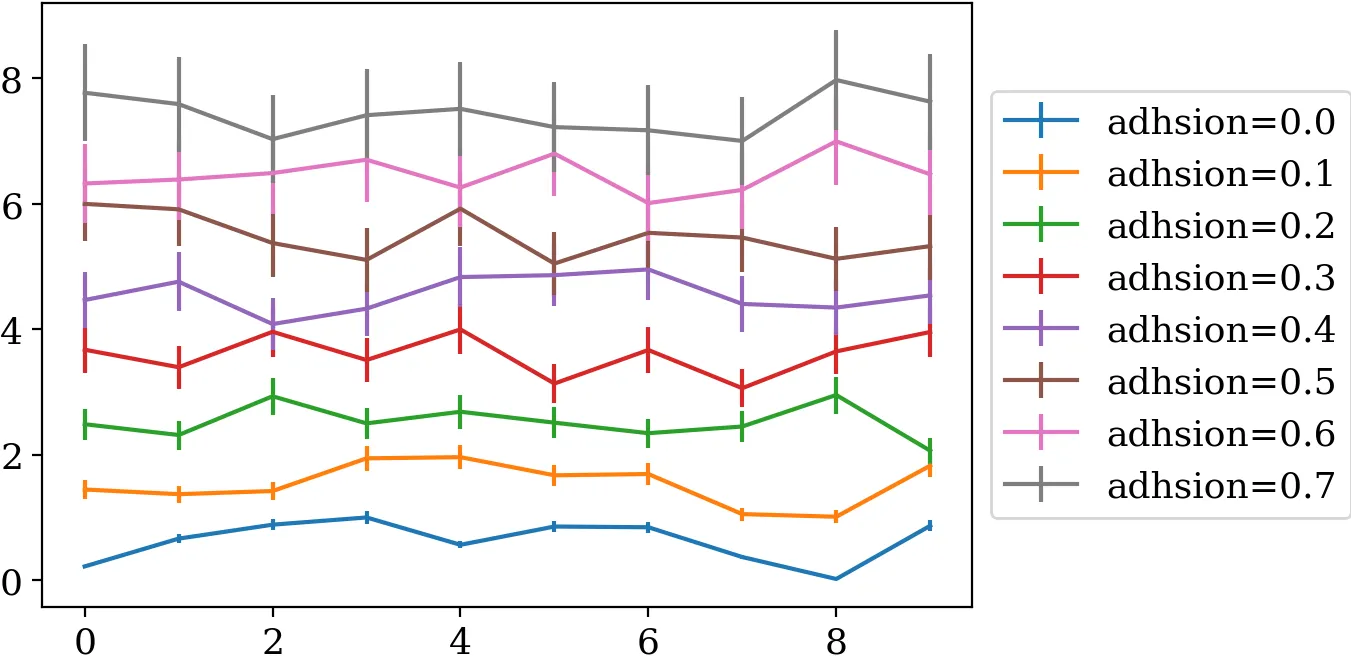
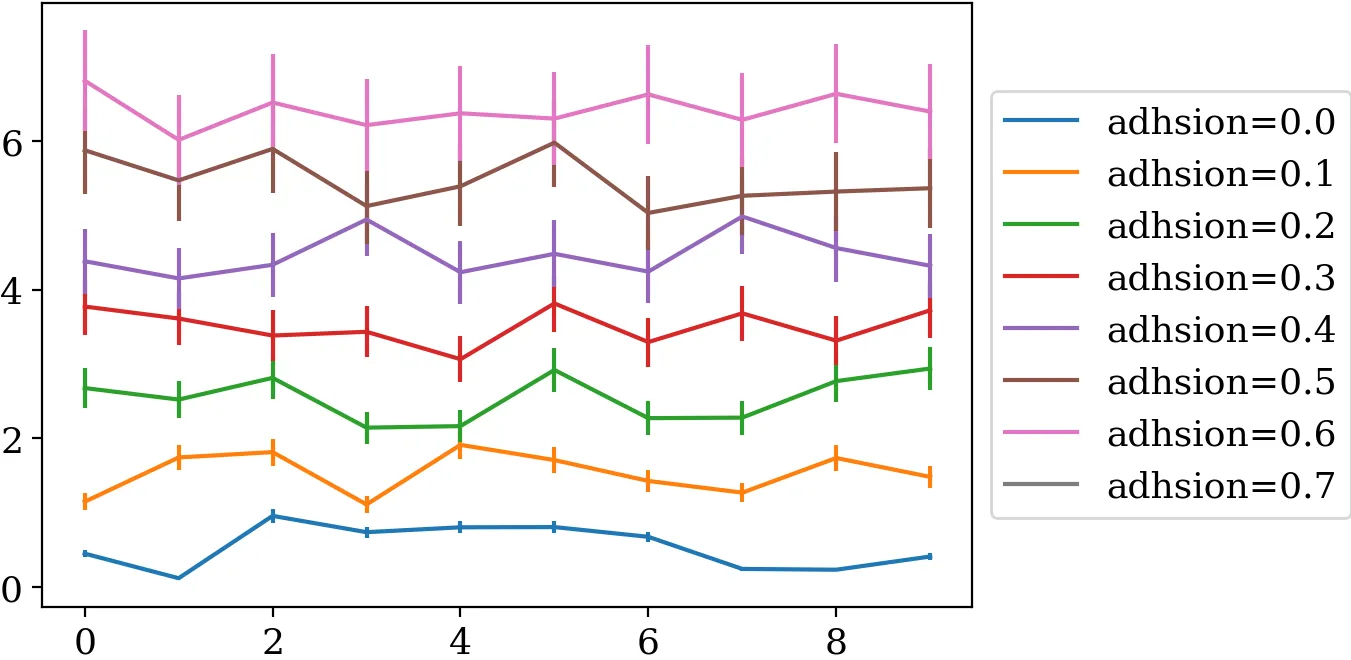
ax1.errorbar(tensionsarray,meanproportionsarray,yerr=stdproportionsarray,label="adhsion={:02.1f}".format(l))- crevellhandles, labels = ax1.get_legend_handles_labels() # 移除误差条 handles = [h[0] for h in handles] ax1.legend(handles, labels,loc='center left', bbox_to_anchor=(1.0, 0.5))- crevell